Technical Analysis of SNA 2024-05-10
Overview:
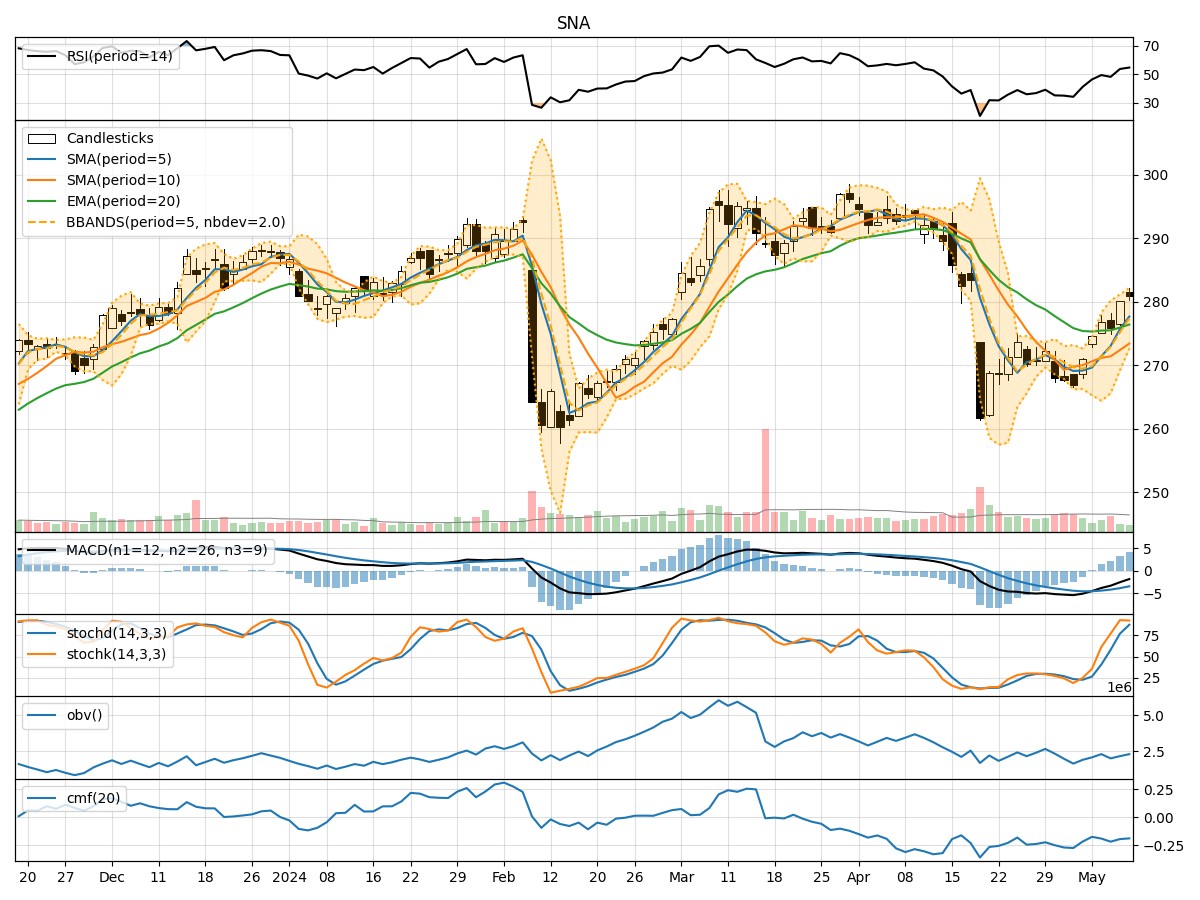
In analyzing the technical indicators for SNA stock over the last 5 days, we will delve into the trend, momentum, volatility, and volume indicators to provide a comprehensive outlook on the possible stock price movement in the coming days. By examining these key indicators, we aim to offer valuable insights and predictions for potential investors.
Trend Analysis:
- Moving Averages (MA): The 5-day Moving Average (MA) has been consistently above the Simple Moving Average (SMA) and Exponential Moving Average (EMA) over the past 5 days, indicating a bullish trend.
- MACD: The MACD line has been gradually increasing, with the MACD line consistently above the signal line, suggesting a bullish momentum in the short term.
Momentum Analysis:
- RSI: The Relative Strength Index (RSI) has been trending upwards, indicating increasing buying pressure and potential for further price appreciation.
- Stochastic Oscillator: Both %K and %D lines of the Stochastic Oscillator are in the overbought zone, suggesting a potential reversal or consolidation in the near future.
Volatility Analysis:
- Bollinger Bands (BB): The stock price has been trading within the upper Bollinger Band (BBU) range, indicating an overbought condition. However, the bands have not shown significant expansion, suggesting a possible consolidation phase.
- Bollinger %B (BBP): The %B indicator is hovering around 0.8, indicating a relatively high price level compared to recent price action.
Volume Analysis:
- On-Balance Volume (OBV): The OBV indicator has shown mixed signals, with fluctuations in volume accumulation. This could imply indecision among market participants.
- Chaikin Money Flow (CMF): The CMF has been negative over the past 5 days, indicating selling pressure in the stock.
Conclusion:
Based on the analysis of the technical indicators, the stock of SNA is currently in an overbought condition as indicated by the Stochastic Oscillator and Bollinger Bands. The bullish trend suggested by the Moving Averages and MACD may face resistance due to the overbought signals. The momentum indicators like RSI show potential for further upside, but caution is advised due to the overbought conditions.
Considering the mixed signals from volume indicators and the negative CMF, there might be a short-term consolidation or a minor pullback in the stock price. Investors should closely monitor the price action and key support levels for potential entry or exit points.
In conclusion, the next few days for SNA stock could see a sideways movement or a slight correction before potentially resuming its upward trend. It is crucial for investors to exercise caution and wait for clearer signals before making significant trading decisions.