Technical Analysis of SNN 2024-05-10
Overview:
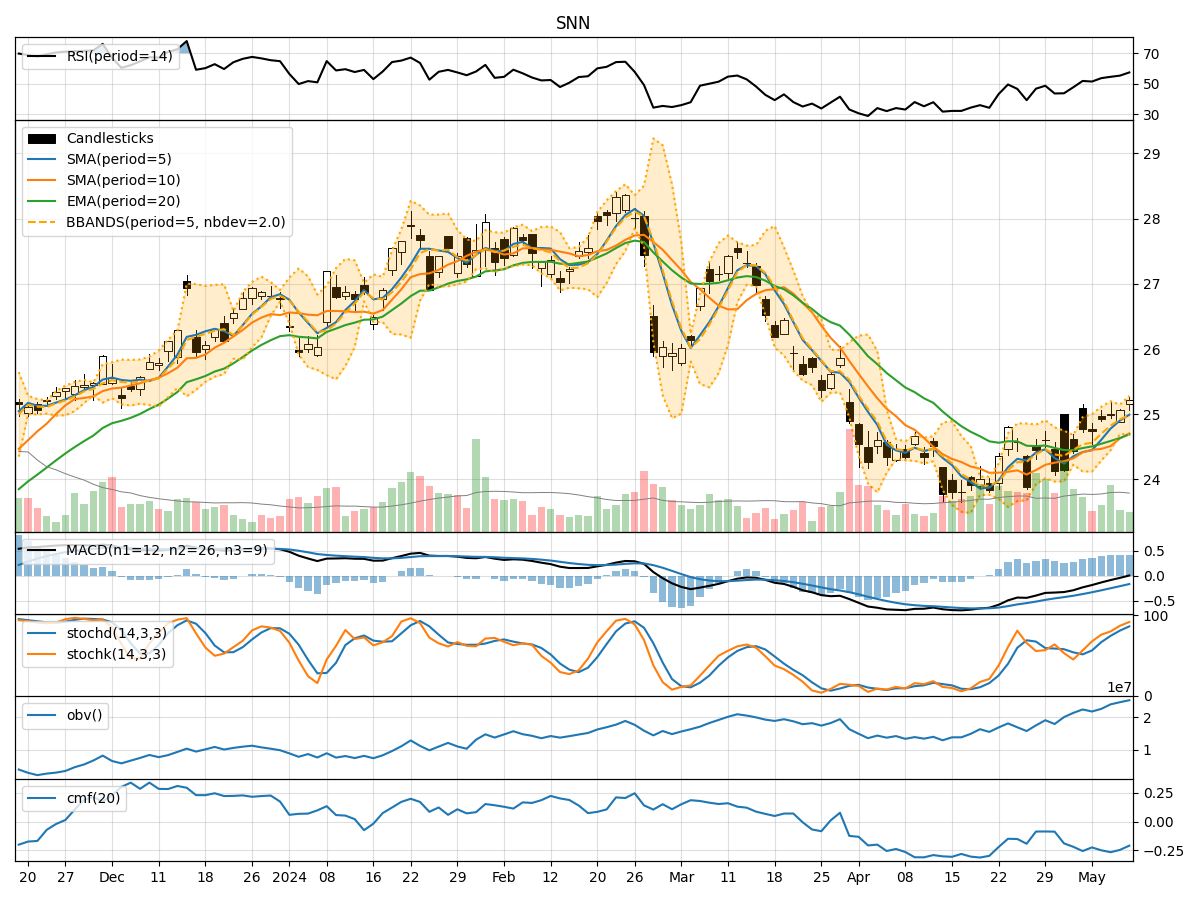
In analyzing the technical indicators for SNN over the last 5 days, we will delve into the trend, momentum, volatility, and volume indicators to provide a comprehensive outlook on the possible stock price movement in the coming days. By examining these key indicators, we aim to offer valuable insights and predictions for informed decision-making.
Trend Analysis:
- Moving Averages (MA): The 5-day MA has been consistently above the closing prices, indicating a short-term uptrend.
- MACD: The MACD line has been positive, with the MACD histogram showing an increasing positive trend, suggesting bullish momentum.
- EMA: The EMA has been trending upwards, supporting the bullish sentiment in the short to medium term.
Key Observation: The trend indicators point towards a bullish outlook for SNN in the near future.
Momentum Analysis:
- RSI: The RSI has been gradually increasing and is currently in the neutral zone, indicating potential room for further upside.
- Stochastic Oscillator: Both %K and %D have been rising, reflecting increasing buying pressure.
- Williams %R: The indicator has been moving towards oversold levels, suggesting a potential reversal to the upside.
Key Observation: Momentum indicators signal a positive momentum building up, supporting a bullish bias.
Volatility Analysis:
- Bollinger Bands (BB): The bands have been widening, indicating increased volatility in the stock price.
- Bollinger %B: The %B indicator has been hovering above 0.5, suggesting an uptrend in volatility.
- Bollinger Band Width: The band width has been expanding, indicating a potential increase in price volatility.
Key Observation: Volatility indicators suggest a heightened level of volatility, which could lead to significant price movements in the coming days.
Volume Analysis:
- On-Balance Volume (OBV): The OBV has been steadily increasing, indicating accumulation by investors.
- Chaikin Money Flow (CMF): The CMF has been negative but improving, signaling a potential shift towards buying pressure.
Key Observation: Volume indicators show a positive accumulation of the stock by investors, supporting the bullish sentiment.
Conclusion:
Based on the comprehensive analysis of the trend, momentum, volatility, and volume indicators, the next few days are likely to see a continuation of the bullish trend for SNN. The positive momentum, increasing buying pressure, expanding volatility, and accumulation by investors all point towards a favorable outlook for the stock price. Traders and investors may consider taking long positions or holding onto existing positions to capitalize on the expected upward movement in the stock price.
Overall Outlook: Bullish
Remember to conduct further research and monitor the indicators for any changes that may impact the stock price movement.