Technical Analysis of SNX 2024-05-10
Overview:
In analyzing the technical indicators for SNX over the last 5 days, we will delve into the trend, momentum, volatility, and volume indicators to provide a comprehensive outlook on the possible stock price movement in the coming days.
Trend Indicators:
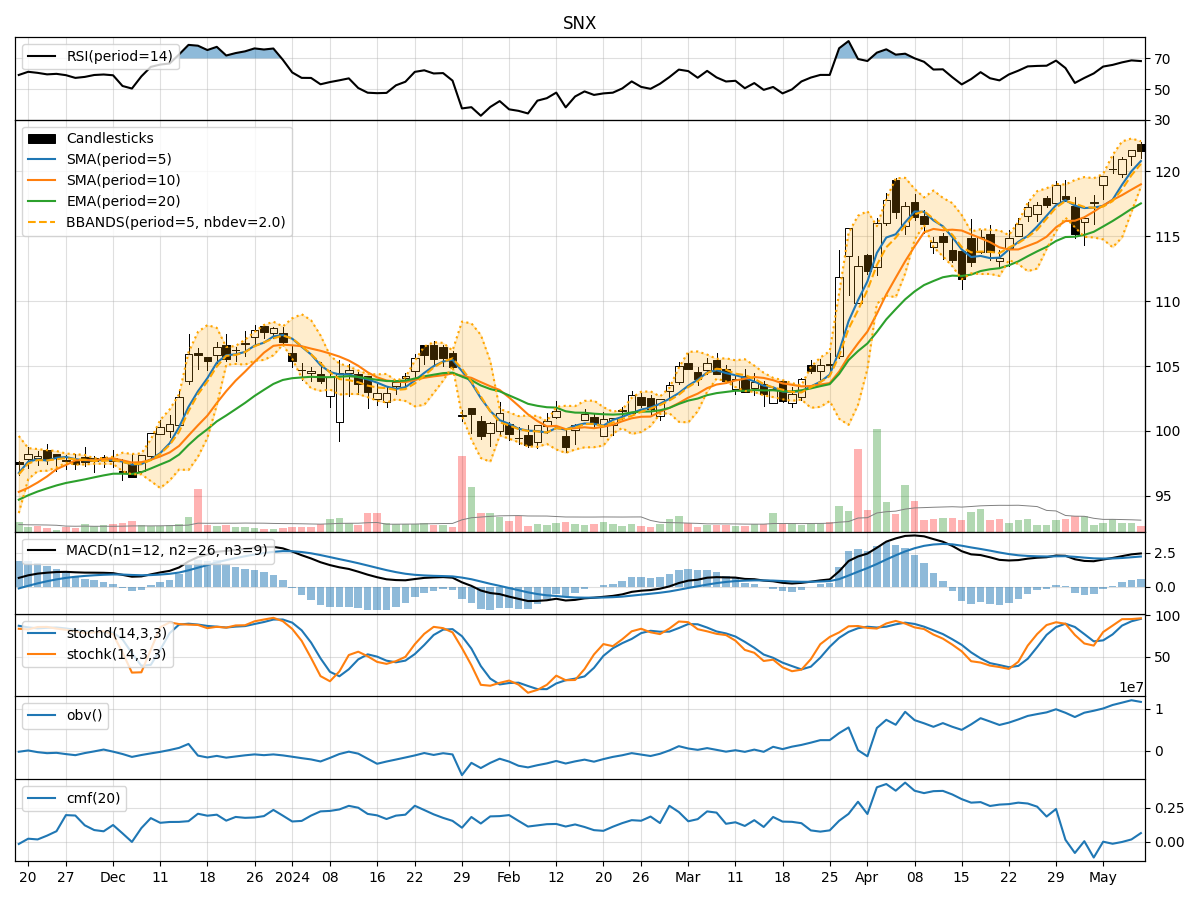
- Moving Averages (MA): The 5-day MA has been consistently above the 10-day SMA, indicating a short-term bullish trend. The EMA(20) has been steadily increasing, reflecting positive momentum.
- MACD: The MACD line has been above the signal line, suggesting bullish momentum. The MACD histogram has been trending upwards, indicating strengthening bullish momentum.
Momentum Indicators:
- RSI: The RSI has been in the overbought territory, indicating a strong bullish momentum.
- Stochastic Oscillator: Both %K and %D have been in the overbought zone, signaling a strong bullish sentiment.
- Williams %R: The indicator has been in the oversold region, suggesting a potential reversal to the upside.
Volatility Indicators:
- Bollinger Bands: The stock price has been trading near the upper Bollinger Band, indicating high volatility and a potential overbought condition.
- Bollinger %B: The %B indicator has been above 0.8, suggesting a potential overbought situation.
Volume Indicators:
- On-Balance Volume (OBV): The OBV has been trending upwards, indicating accumulation by investors.
- Chaikin Money Flow (CMF): The CMF has been positive, reflecting buying pressure in the stock.
Key Observations and Opinions:
- Trend: The trend indicators suggest a strong bullish sentiment in the short term.
- Momentum: Momentum indicators indicate a robust bullish momentum, but some indicators are in the overbought zone.
- Volatility: High volatility near the upper Bollinger Band may signal a potential pullback or consolidation.
- Volume: Increasing OBV and positive CMF indicate buying interest in the stock.
Conclusion:
Based on the analysis of the technical indicators, the stock price of SNX is likely to experience further upward movement in the coming days. However, caution is advised as some momentum indicators are in the overbought zone, and high volatility near the upper Bollinger Band may lead to a short-term consolidation or pullback before resuming the uptrend. Investors should closely monitor the price action and key support/resistance levels for potential entry or exit points.