Technical Analysis of SON 2024-05-10
Overview:
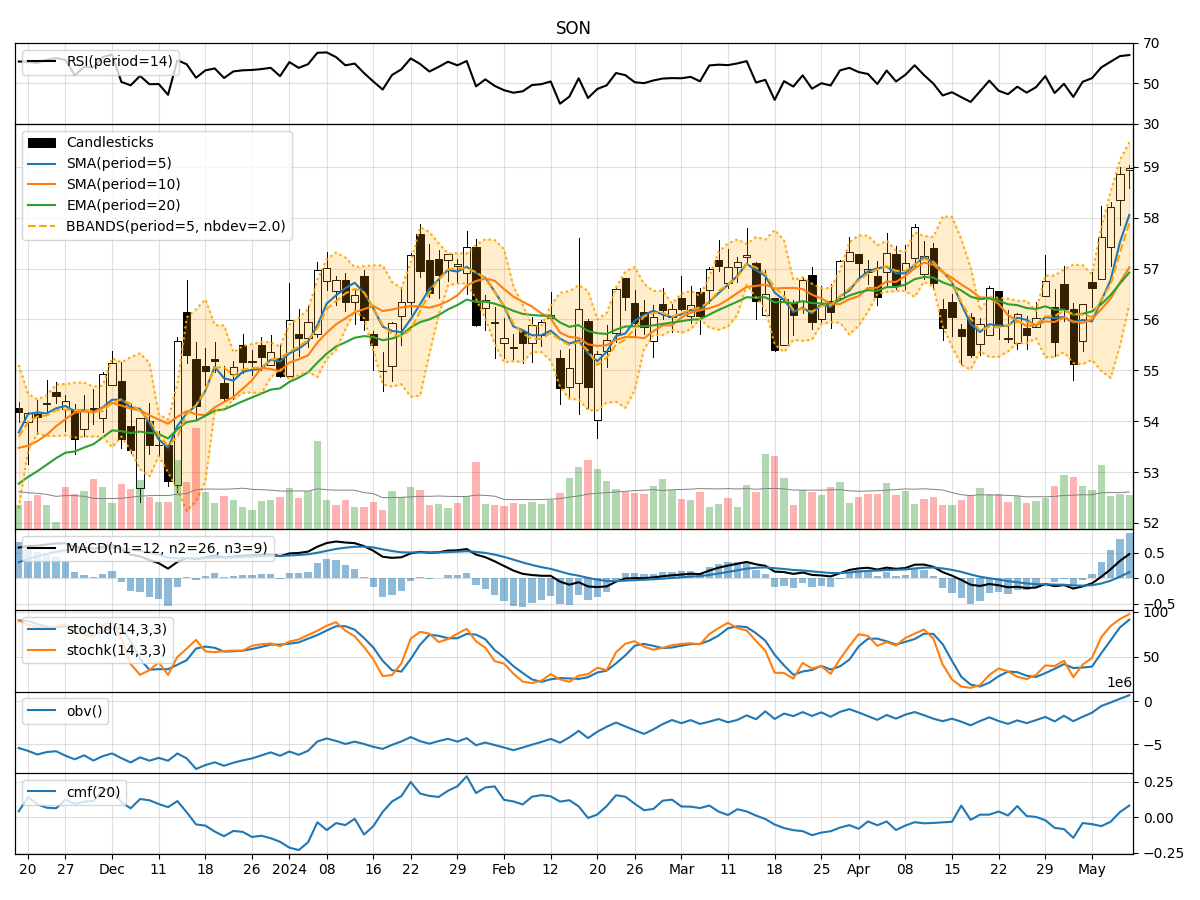
In analyzing the technical indicators for SON over the last 5 days, we will delve into the trend, momentum, volatility, and volume indicators to provide a comprehensive outlook on the possible stock price movement in the coming days. By examining key metrics such as moving averages, MACD, RSI, Bollinger Bands, and OBV, we aim to offer valuable insights and predictions for SON's future price action.
Trend Indicators:
- Moving Averages (MA): The 5-day MA has been consistently trending upwards, indicating a positive momentum in the stock price.
- MACD: The MACD line has been above the signal line for the past 5 days, suggesting a bullish trend.
- EMA: The EMA has also been on an upward trajectory, supporting the bullish sentiment in the short to medium term.
Momentum Indicators:
- RSI: The RSI has been steadily increasing and is currently in the overbought territory, signaling strong buying momentum.
- Stochastic Oscillator: Both %K and %D have been rising, indicating increasing buying pressure and potential for further upside movement.
- Williams %R: The indicator is in the oversold region, suggesting a potential reversal to the upside.
Volatility Indicators:
- Bollinger Bands: The stock price has been trading near the upper Bollinger Band, indicating high volatility and a potential continuation of the uptrend.
- Bollinger %B: The %B value is above 0.5, suggesting that the stock is trading above the middle band and is in a bullish phase.
Volume Indicators:
- On-Balance Volume (OBV): The OBV has been steadily increasing over the past 5 days, indicating strong buying interest and accumulation of the stock.
- Chaikin Money Flow (CMF): The CMF has been positive, reflecting buying pressure and potential price appreciation.
Conclusion:
Based on the analysis of the technical indicators, SON is likely to experience further upward movement in the coming days. The bullish trend supported by the moving averages, MACD, RSI, and Stochastic Oscillator suggests a favorable outlook for the stock price. Additionally, the increasing OBV and positive CMF indicate strong buying interest and accumulation, further supporting the bullish thesis.
Key Takeaway: The combination of bullish trend, positive momentum, high volatility near the upper Bollinger Band, and strong volume accumulation paints a compelling picture for SON's future price action. Therefore, the next few days are likely to see an upward movement in SON's stock price.