Technical Analysis of SPB 2024-05-10
Overview:
In analyzing the technical indicators for SPB over the last 5 days, we will delve into the trend, momentum, volatility, and volume indicators to provide a comprehensive outlook on the possible stock price movement in the coming days. By examining these key indicators, we aim to offer valuable insights and predictions for potential investors.
Trend Analysis:
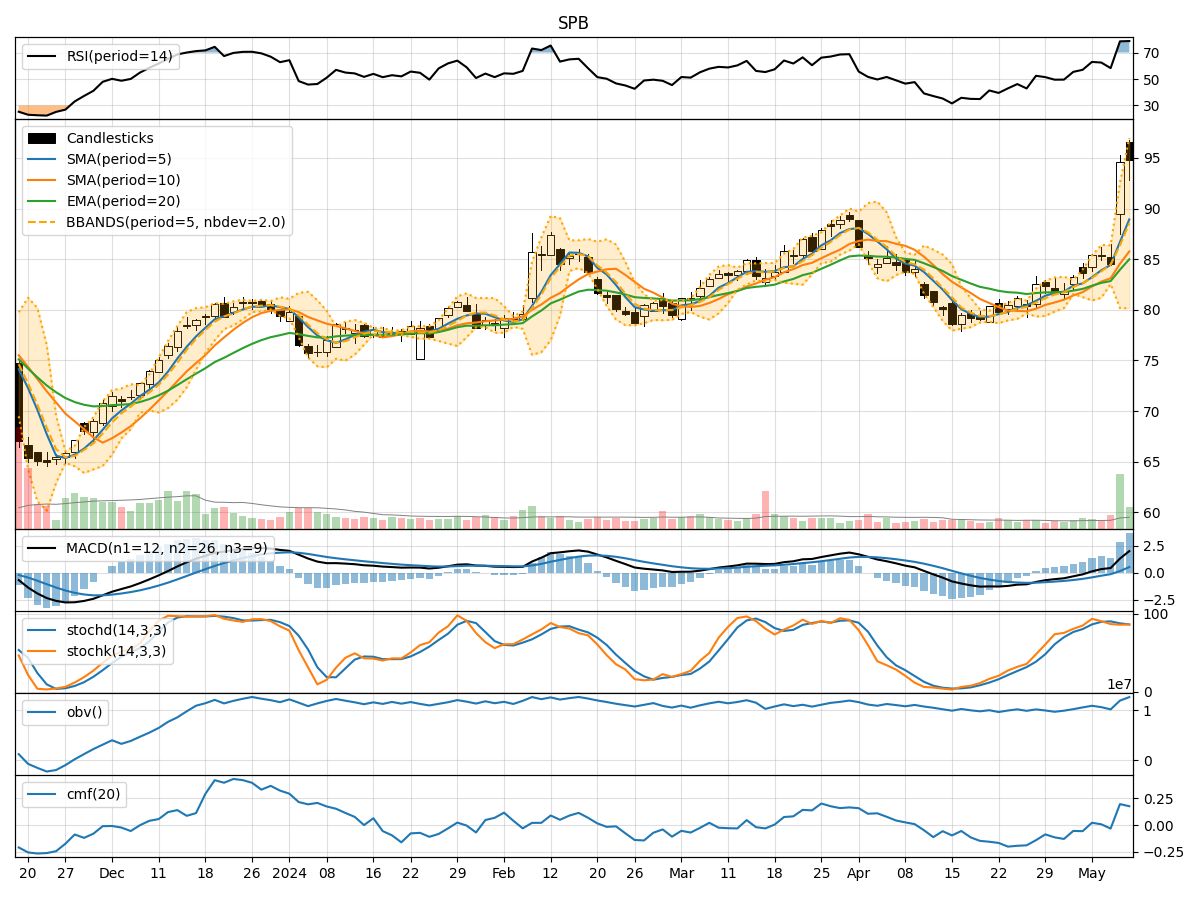
- Moving Averages (MA): The 5-day Moving Average (MA) has been consistently rising, indicating a bullish trend in the short term.
- MACD: The MACD line has been above the signal line for the past few days, suggesting a bullish momentum.
- Relative Strength Index (RSI): The RSI has been fluctuating but generally staying within the neutral to overbought territory, indicating a mixed sentiment.
Momentum Analysis:
- Stochastic Oscillator: The Stochastic Oscillator has been hovering around the overbought territory, suggesting a potential reversal or consolidation.
- Williams %R (WillR): The Williams %R has been fluctuating but generally indicating an oversold condition in the short term.
Volatility Analysis:
- Bollinger Bands (BB): The Bollinger Bands have widened, indicating increased volatility in the stock price.
- Bollinger %B (BBP): The %B has been fluctuating but generally staying within the normal range, suggesting no extreme conditions.
Volume Analysis:
- On-Balance Volume (OBV): The OBV has shown mixed signals, indicating some distribution but also accumulation in recent days.
- Chaikin Money Flow (CMF): The CMF has been positive, suggesting buying pressure in the stock.
Key Observations:
- The trend indicators suggest a bullish sentiment in the short term.
- Momentum indicators show a potential overbought condition, signaling a need for caution.
- Volatility has increased, indicating potential price swings.
- Volume indicators show mixed signals but with a slight bias towards accumulation.
Conclusion:
Based on the analysis of the technical indicators, the stock price of SPB is likely to experience further upward movement in the coming days. However, caution is advised due to the potential overbought condition indicated by the momentum indicators. Traders may consider taking profits or implementing risk management strategies to navigate the increased volatility. Overall, the outlook remains bullish with a possibility of consolidation before potential further upside.