Technical Analysis of SPG 2024-05-10
Overview:
In analyzing the technical indicators for SPG over the last 5 days, we will delve into the trend, momentum, volatility, and volume indicators to provide a comprehensive outlook on the possible stock price movement. By examining these key aspects, we aim to offer valuable insights and predictions for the upcoming days.
Trend Analysis:
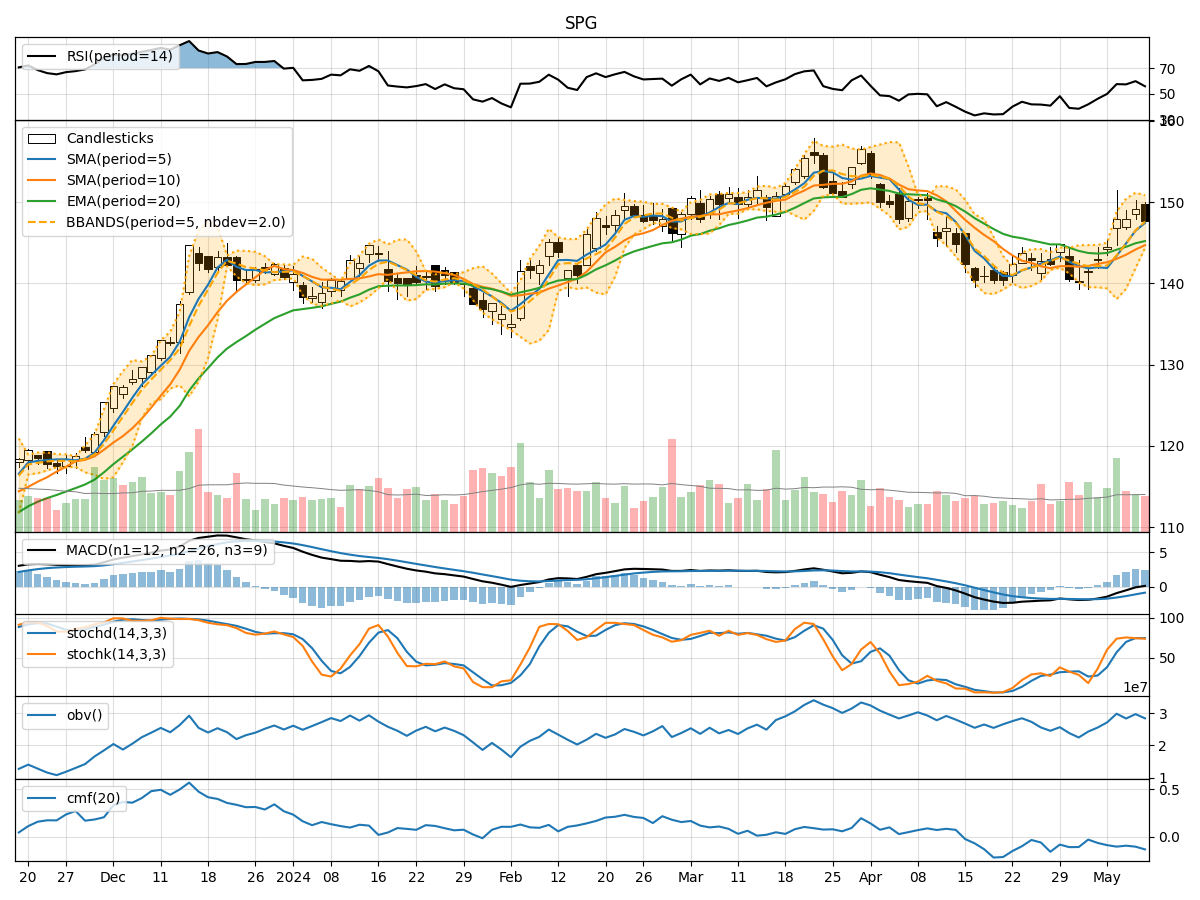
- Moving Averages (MA): The 5-day Moving Average has been consistently rising, indicating a bullish trend in the short term.
- MACD: The MACD line has been above the signal line, suggesting positive momentum in the stock price.
- EMA: The Exponential Moving Average has also been trending upwards, supporting the bullish sentiment.
Momentum Analysis:
- RSI: The Relative Strength Index has been fluctuating around the neutral zone, indicating a lack of strong momentum either way.
- Stochastic Oscillator: Both %K and %D have been relatively high, suggesting potential overbought conditions.
- Williams %R: The Williams %R is showing oversold conditions, indicating a possible reversal in the short term.
Volatility Analysis:
- Bollinger Bands: The stock price has been trading within the Bollinger Bands, with the bands narrowing, indicating reduced volatility.
- Bollinger %B: The %B indicator is below 1, suggesting the stock is trading below the upper band, potentially signaling a buying opportunity.
Volume Analysis:
- On-Balance Volume (OBV): The OBV has been fluctuating, indicating mixed buying and selling pressure.
- Chaikin Money Flow (CMF): The CMF has been negative, suggesting outflow of money from the stock.
Key Observations:
- The trend indicators point towards a bullish sentiment in the short term.
- Momentum indicators show mixed signals, with potential for a reversal in the near future.
- Volatility has been decreasing, indicating a possible period of consolidation.
- Volume indicators suggest a balance between buying and selling pressure.
Conclusion:
Based on the analysis of the technical indicators, the stock price of SPG is likely to experience sideways movement in the next few days. The bullish trend indicated by moving averages and MACD may be offset by the mixed signals from momentum indicators and the negative CMF. The decreasing volatility and balanced volume further support the view of consolidation. Traders should exercise caution and closely monitor key levels for potential breakout or breakdown scenarios.