Technical Analysis of SPR 2024-05-10
Overview:
In analyzing the technical indicators for SPR over the last 5 days, we will delve into the trend, momentum, volatility, and volume indicators to provide a comprehensive outlook on the possible stock price movement. By examining these key aspects, we aim to offer valuable insights and predictions for the upcoming days.
Trend Analysis:
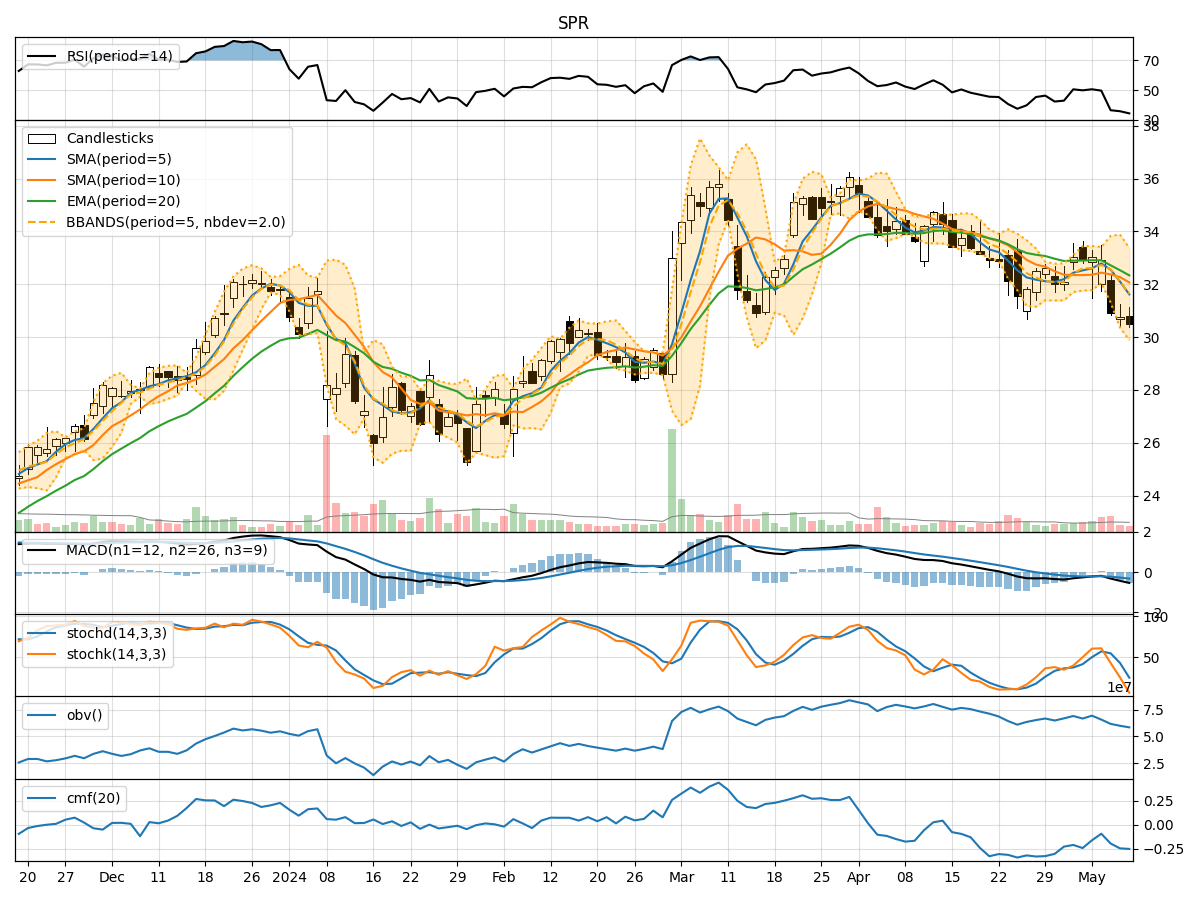
- Moving Averages (MA): The 5-day Moving Average (MA) has been declining steadily, indicating a bearish trend in the short term.
- MACD: The Moving Average Convergence Divergence (MACD) has been consistently negative, suggesting a bearish momentum in the stock.
- EMA: The Exponential Moving Average (EMA) has also been trending downwards, reinforcing the bearish sentiment in the stock.
Momentum Analysis:
- RSI: The Relative Strength Index (RSI) has been decreasing, reflecting a weakening momentum in the stock.
- Stochastic Oscillator: Both %K and %D of the Stochastic Oscillator have been declining, indicating a bearish momentum.
- Williams %R: The Williams %R is in the oversold territory, signaling a potential reversal or continuation of the downtrend.
Volatility Analysis:
- Bollinger Bands: The Bollinger Bands have been narrowing, suggesting decreasing volatility in the stock.
- Bollinger %B: The %B indicator is close to 0, indicating that the stock price is near the lower band, potentially oversold.
Volume Analysis:
- On-Balance Volume (OBV): The OBV has been decreasing, indicating selling pressure in the stock.
- Chaikin Money Flow (CMF): The CMF has been negative, suggesting outflow of money from the stock.
Key Observations:
- The stock is currently in a downtrend based on moving averages and MACD.
- Momentum indicators like RSI and Stochastic Oscillator are showing bearish signals.
- Volatility is decreasing, which could indicate a period of consolidation or a potential reversal.
- The OBV and CMF suggest selling pressure and a lack of buying interest in the stock.
Conclusion:
Based on the analysis of the technical indicators, the next few days for SPR are likely to see further downside movement. The bearish trend, negative momentum, and selling pressure indicated by volume indicators all point towards a continuation of the current downtrend. Traders and investors should exercise caution and consider short-term strategies to capitalize on potential downside opportunities.