Technical Analysis of SRL 2024-05-10
Overview:
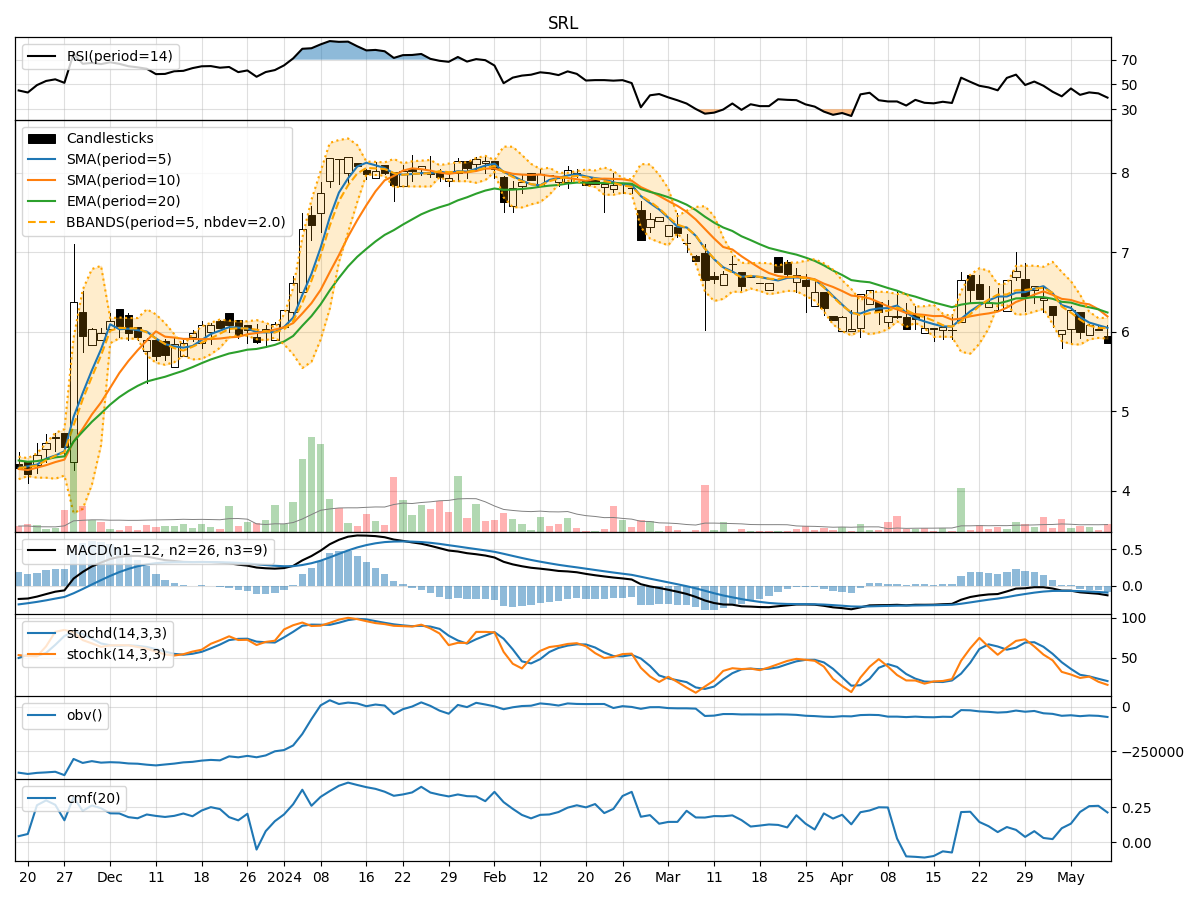
In analyzing the technical indicators for SRL stock over the last 5 days, we will delve into the trends, momentum, volatility, and volume aspects to provide a comprehensive outlook on the possible stock price movement in the coming days. By examining key indicators such as moving averages, MACD, RSI, Bollinger Bands, and OBV, we aim to offer valuable insights and predictions for informed decision-making.
Trend Analysis:
- Moving Averages (MA): The 5-day MA has been consistently below the closing prices, indicating a short-term downtrend.
- MACD: The MACD line has been negative, with the MACD histogram showing a decreasing trend, suggesting bearish momentum.
Momentum Analysis:
- RSI: The RSI has been below 50, indicating bearish momentum and potential oversold conditions.
- Stochastic Oscillator: Both %K and %D have been declining, signaling weakening momentum.
Volatility Analysis:
- Bollinger Bands (BB): The stock price has been trading below the lower Bollinger Band, indicating oversold conditions and potential for a reversal.
Volume Analysis:
- On-Balance Volume (OBV): The OBV has been negative, suggesting distribution and selling pressure.
Key Observations:
- The stock is currently in a downtrend based on moving averages and MACD.
- Momentum indicators like RSI and Stochastic Oscillator point towards bearish sentiment.
- Volatility indicators suggest oversold conditions, potentially signaling a reversal.
- Volume indicators reflect selling pressure and distribution.
Conclusion:
Based on the analysis of the technical indicators, the stock is likely to experience further downward movement in the coming days. The bearish trend, coupled with negative momentum and selling pressure, indicates a high probability of continued price decline. Traders and investors should exercise caution and consider waiting for signs of a reversal or a significant shift in market sentiment before considering any long positions. It is advisable to closely monitor the price action and key technical levels for potential entry or exit points.