Technical Analysis of ST 2024-05-10
Overview:
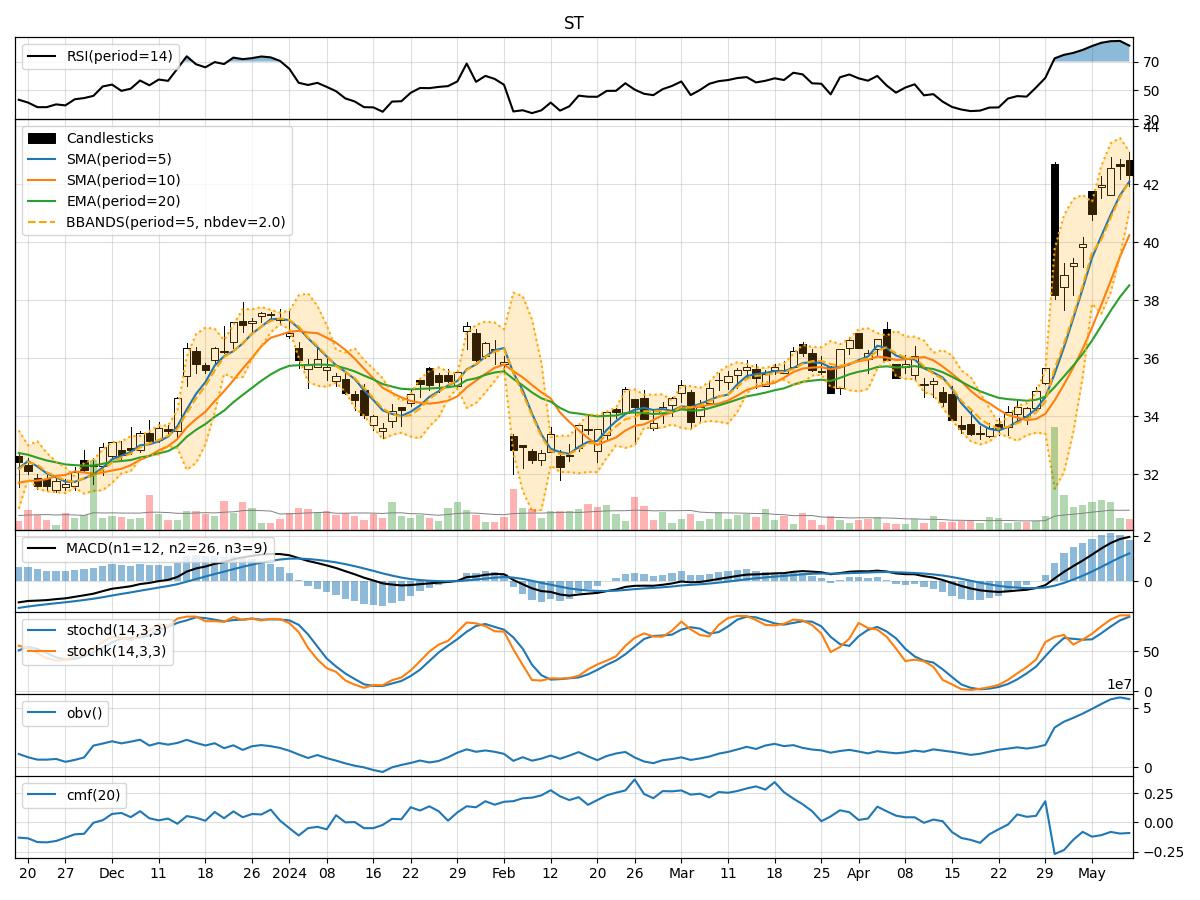
In the last 5 trading days, the stock has shown a consistent uptrend in both price and volume. The moving averages have been trending upwards, indicating a bullish momentum. Momentum indicators such as RSI and Stochastic oscillators are in overbought territory, suggesting a potential reversal or consolidation. Volatility indicators like Bollinger Bands show narrowing bands, indicating a possible decrease in volatility. Volume indicators like OBV and CMF have been relatively stable.
Trend Analysis:
- Moving Averages (MA): The stock price has been consistently above the short-term moving averages, indicating a strong bullish trend.
- MACD: The MACD line has been above the signal line, showing bullish momentum.
- RSI: The RSI is in overbought territory, suggesting a potential pullback or consolidation.
- Bollinger Bands (BB): The bands have been narrowing, indicating decreasing volatility.
Momentum Analysis:
- Stochastic Oscillators: Both %K and %D are in overbought territory, signaling a potential reversal.
- Williams %R (WillR): The stock is in oversold territory, indicating a potential reversal.
Volatility Analysis:
- Bollinger Bands (BB): The narrowing of the bands suggests a decrease in volatility.
- Bollinger %B (BBP): The %B is below 1, indicating the stock is trading below the upper band.
Volume Analysis:
- On-Balance Volume (OBV): The OBV has been relatively stable, indicating consistent buying pressure.
- Chaikin Money Flow (CMF): The CMF is negative, suggesting some distribution in the stock.
Key Observations:
- The stock is currently in a strong uptrend based on moving averages and MACD.
- Momentum indicators are signaling overbought conditions, indicating a potential reversal or consolidation.
- Volatility is decreasing based on Bollinger Bands, which could lead to a period of consolidation.
- Volume indicators show stable buying pressure but some distribution based on CMF.
Conclusion:
Based on the technical indicators and analysis: - Short-Term: The stock may experience a short-term pullback or consolidation due to overbought conditions in momentum indicators. - Medium-Term: The overall trend remains bullish, but caution is advised due to potential profit-taking at overbought levels. - Long-Term: The long-term outlook remains positive, but investors should monitor for any signs of trend reversal or weakening buying pressure.
Recommendation:
- Short-Term Traders: Consider taking profits or setting tight stop-loss orders to protect gains.
- Medium to Long-Term Investors: Hold positions but monitor closely for any signs of trend reversal or weakening momentum.
Overall Sentiment:
- Consolidation Expected: The stock is likely to consolidate in the short term before potentially resuming its uptrend.
- Caution Advised: Due to overbought conditions, investors should exercise caution and closely monitor key support levels for potential reversals.
Disclaimer:
Remember that technical analysis is not a guaranteed predictor of future price movements, and other fundamental factors can influence stock prices. It is essential to conduct thorough research and consider multiple indicators before making investment decisions. Consulting with a financial advisor is recommended for personalized advice tailored to your specific investment goals and risk tolerance.