Technical Analysis of STE 2024-05-10
Overview:
In analyzing the technical indicators for STE over the last 5 days, we will delve into the trend, momentum, volatility, and volume indicators to provide a comprehensive outlook on the possible stock price movement in the coming days. By examining these key aspects, we aim to offer valuable insights and predictions to guide your investment decisions.
Trend Analysis:
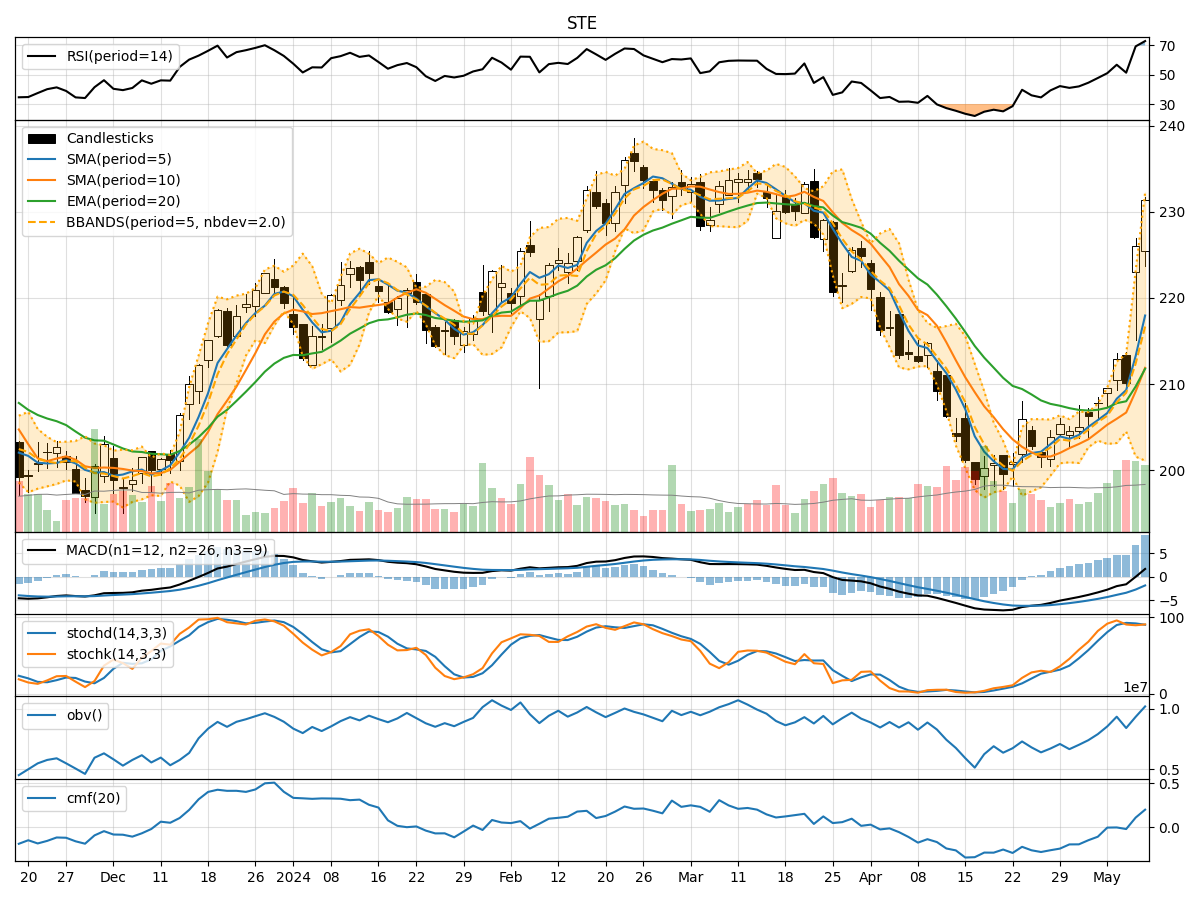
- Moving Averages (MA): The 5-day MA has been consistently rising, indicating a bullish trend in the short term.
- MACD: The MACD line has been increasing, crossing above the signal line, suggesting a bullish momentum.
- EMA: The EMA has been trending upwards, supporting the bullish sentiment in the stock.
Key Observation: The trend indicators point towards a strong bullish trend in the stock.
Momentum Analysis:
- RSI: The RSI has been increasing and is currently in the overbought territory, signaling a strong bullish momentum.
- Stochastic Oscillator: Both %K and %D lines are in the overbought zone, indicating a potential reversal or consolidation.
- Williams %R: The indicator is in the oversold region, suggesting a possible reversal in the stock price.
Key Observation: Momentum indicators show a mixed signal with RSI indicating strong bullish momentum while Stochastic and Williams %R hint at a potential reversal.
Volatility Analysis:
- Bollinger Bands: The stock price has been consistently trading above the upper Bollinger Band, indicating overbought conditions.
- Bollinger Band Width: The band width has been widening, suggesting increased volatility in the stock.
Key Observation: The volatility indicators signal overbought conditions and heightened volatility in the stock.
Volume Analysis:
- On-Balance Volume (OBV): The OBV has been fluctuating, indicating indecision among investors.
- Chaikin Money Flow (CMF): The CMF has been negative, suggesting selling pressure in the stock.
Key Observation: Volume indicators reflect mixed sentiment with OBV showing indecision and CMF indicating selling pressure.
Conclusion:
Based on the analysis of trend, momentum, volatility, and volume indicators, the next few days' possible stock price movement for STE is likely to experience a short-term pullback or consolidation. While the trend indicators suggest a bullish sentiment, the momentum indicators show signs of a potential reversal or consolidation. Additionally, the volatility indicators point towards overbought conditions, and the volume indicators indicate selling pressure.
Overall, the stock is expected to undergo a period of consolidation or a minor correction in the coming days. Investors should exercise caution and consider potential profit-taking opportunities in the short term.