Technical Analysis of STEL 2024-05-10
Overview:
In analyzing the technical indicators for STEL over the last 5 days, we will delve into the trend, momentum, volatility, and volume indicators to provide a comprehensive outlook on the possible stock price movement in the coming days.
Trend Analysis:
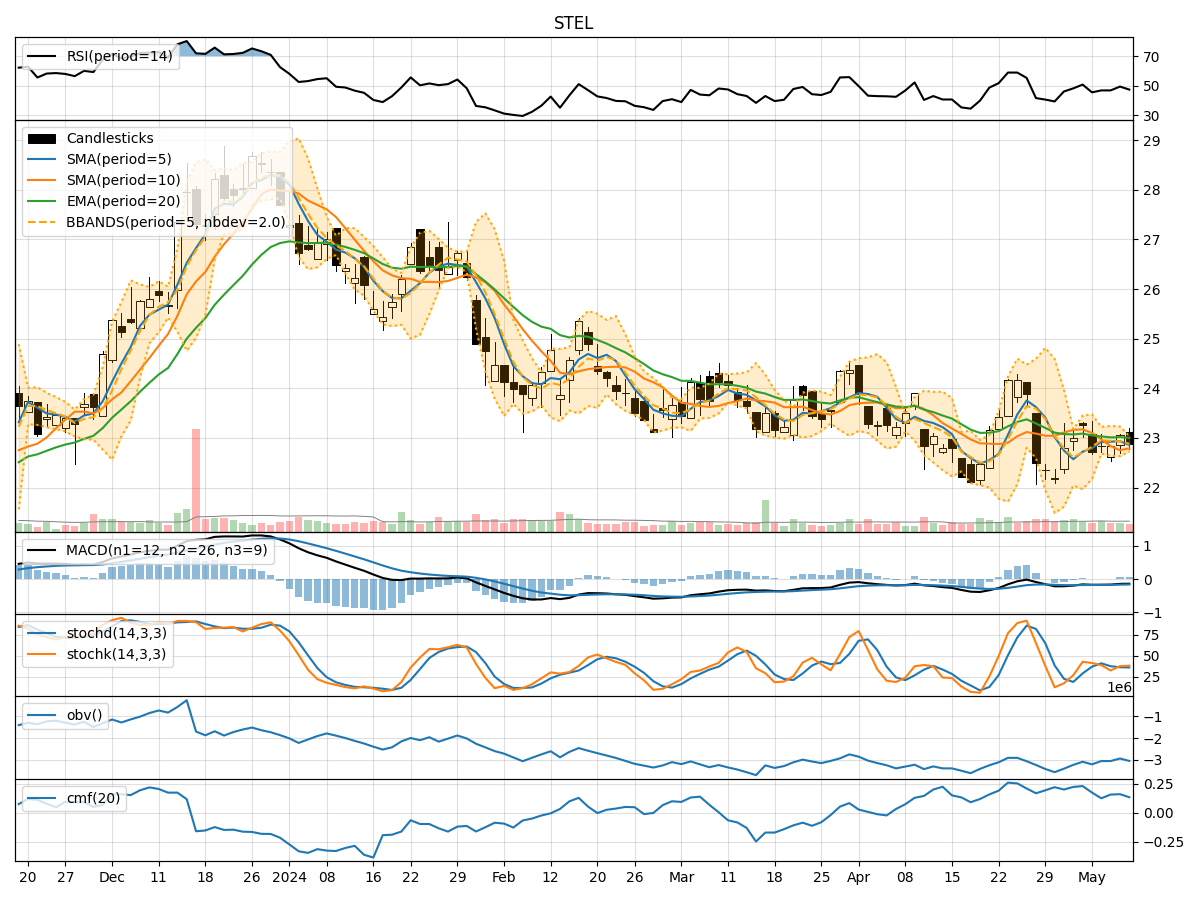
- Moving Averages (MA): The 5-day Moving Average (MA) has been fluctuating around the $22.80 level, indicating a sideways trend.
- MACD: The MACD line has been consistently below the signal line, suggesting a bearish momentum in the short term.
- EMA: The Exponential Moving Average (EMA) has been hovering around $23.00, reflecting a potential resistance level.
Momentum Analysis:
- RSI: The Relative Strength Index (RSI) has been oscillating around the 50 level, indicating a neutral momentum.
- Stochastic Oscillator: Both %K and %D have been fluctuating in the oversold territory, signaling a potential reversal.
- Williams %R: The Williams %R is showing oversold conditions, hinting at a possible buying opportunity.
Volatility Analysis:
- Bollinger Bands: The stock price has been trading within the Bollinger Bands, with the bands narrowing, suggesting a period of consolidation.
- Bollinger %B: The %B indicator is around 0.5, indicating the stock is trading at the middle of the bands.
Volume Analysis:
- On-Balance Volume (OBV): The OBV has shown mixed signals, with some days experiencing selling pressure and others showing accumulation.
- Chaikin Money Flow (CMF): The CMF has been positive but relatively flat, indicating a balance between buying and selling pressure.
Key Observations:
- The stock is currently in a consolidation phase, as indicated by the sideways movement in moving averages and Bollinger Bands.
- Momentum indicators suggest a potential reversal in the oversold territory, pointing towards a bullish momentum shift.
- Volatility has decreased, indicating a period of stability in the stock price.
- Volume indicators show mixed signals, reflecting uncertainty in market participation.
Conclusion:
Based on the analysis of the technical indicators, the next few days for STEL could see a potential upward movement. The momentum indicators suggest a shift towards bullish sentiment, while the consolidation phase and decreasing volatility may pave the way for a breakout to the upside. Traders should monitor key resistance levels around $23.00 for potential bullish confirmation.