Technical Analysis of STG 2024-05-10
Overview:
In analyzing the technical indicators for the stock STG over the last 5 days, we will delve into the trends, momentum, volatility, and volume indicators to provide a comprehensive outlook on the possible stock price movement in the coming days. By examining these key indicators, we aim to offer valuable insights and predictions for potential investors.
Trend Indicators:
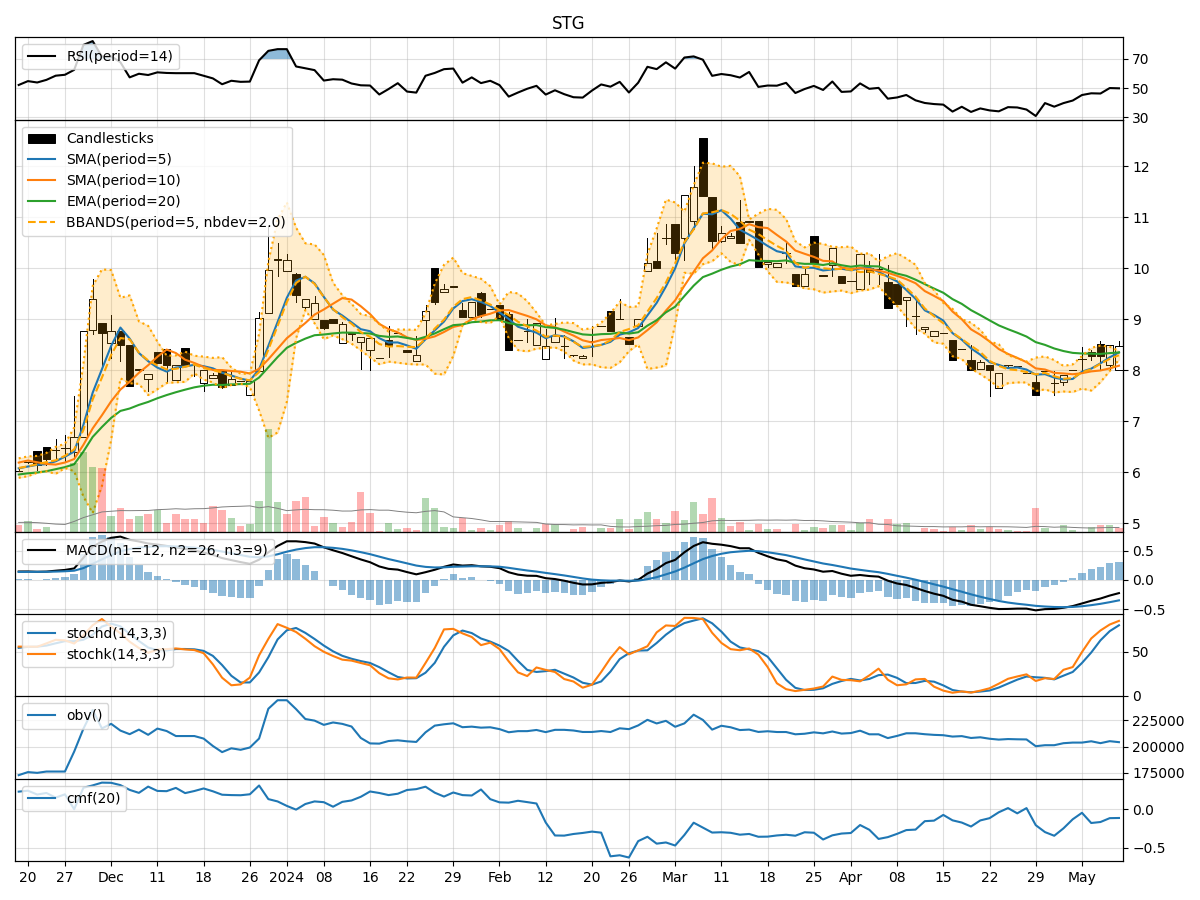
- Moving Averages (MA): The 5-day MA has been showing an upward trend, indicating a positive momentum in the stock price.
- MACD: The MACD has been consistently negative but showing signs of convergence towards the signal line, suggesting a potential reversal in the downtrend.
- EMA: The EMA has been relatively stable, indicating a gradual price movement without significant volatility.
Momentum Indicators:
- RSI: The RSI has been hovering around the neutral zone, indicating a balanced momentum between buying and selling pressure.
- Stochastic Oscillator: Both %K and %D have been in the overbought territory, suggesting a potential reversal or consolidation phase.
- Williams %R: The indicator has been in the oversold region, signaling a possible buying opportunity.
Volatility Indicators:
- Bollinger Bands: The bands have been narrowing, indicating decreasing volatility and a potential breakout in the near future.
- Bollinger %B: The %B indicator has been fluctuating within a range, suggesting a period of consolidation.
Volume Indicators:
- On-Balance Volume (OBV): The OBV has been fluctuating, indicating indecision among investors regarding the stock.
- Chaikin Money Flow (CMF): The CMF has been negative, reflecting selling pressure in the stock.
Key Observations and Opinions:
- Trend: The stock is showing signs of a potential reversal in the downtrend, supported by the positive movement in the 5-day MA.
- Momentum: The momentum indicators suggest a mixed sentiment, with the RSI indicating a neutral stance and the stochastic oscillator signaling a possible reversal.
- Volatility: The narrowing Bollinger Bands indicate a period of low volatility, potentially leading to a breakout in the stock price.
- Volume: The volume indicators reflect indecision and selling pressure among investors, contributing to the overall uncertainty in the stock.
Conclusion:
Based on the analysis of the technical indicators, the stock STG is likely to experience sideways consolidation in the coming days. While there are indications of a potential reversal in the downtrend, the mixed signals from the momentum and volume indicators suggest a period of indecision among investors. Traders should closely monitor the breakout levels indicated by the Bollinger Bands for potential trading opportunities.