Technical Analysis of STNG 2024-05-10
Overview:
In analyzing the technical indicators for STNG over the last 5 days, we will delve into the trends, momentum, volatility, and volume aspects to provide a comprehensive outlook on the possible stock price movement in the coming days.
Trend Analysis:
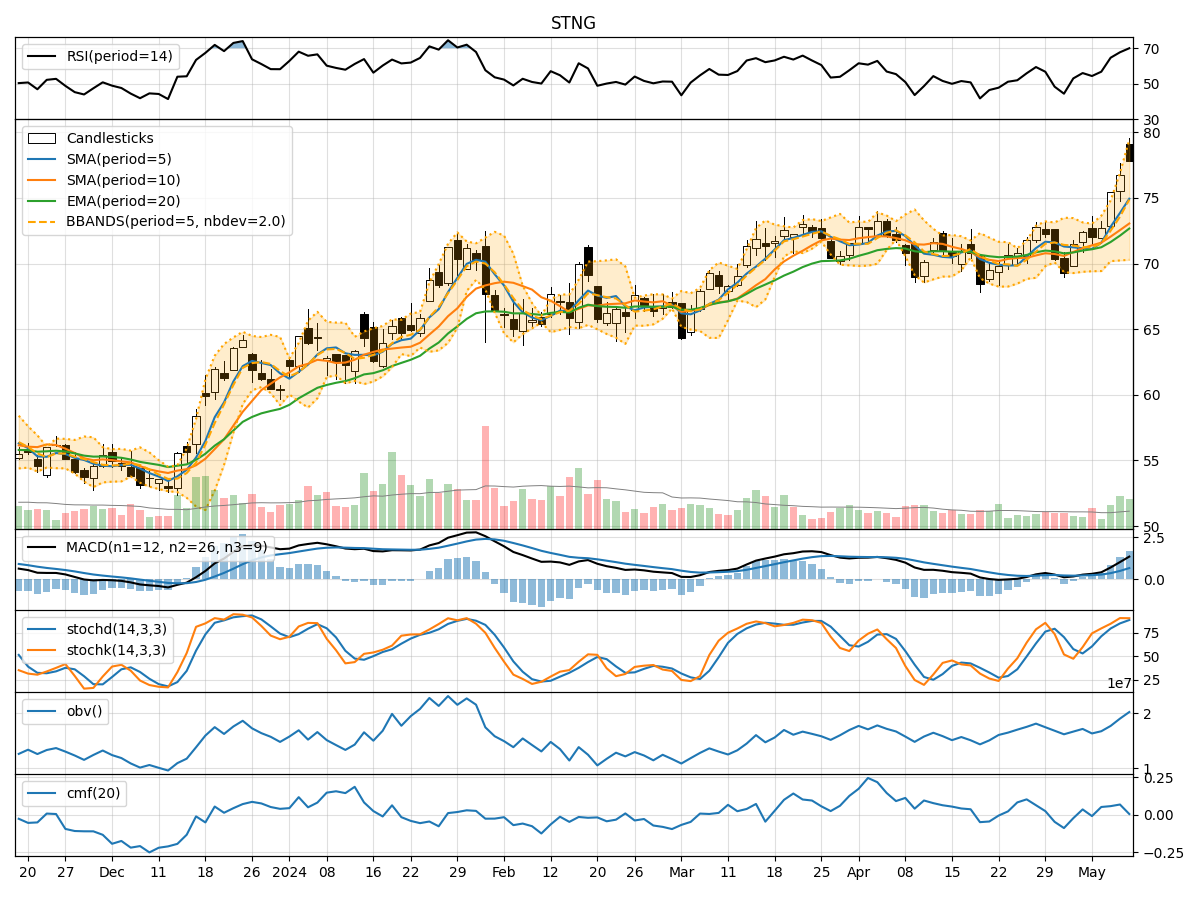
- Moving Averages (MA): The 5-day Moving Average has been consistently rising, indicating an upward trend in the stock price.
- MACD: The MACD line has been above the signal line for all 5 days, suggesting bullish momentum.
- EMA: The Exponential Moving Average has also been trending upwards, supporting the bullish sentiment.
Key Observation: The trend indicators point towards a strong bullish trend in the stock price.
Momentum Analysis:
- RSI: The Relative Strength Index has been increasing steadily, indicating growing buying momentum.
- Stochastic Oscillator: Both %K and %D have been in the overbought zone, suggesting a strong bullish momentum.
- Williams %R: The indicator has been consistently in the oversold territory, signaling a potential reversal.
Key Observation: Momentum indicators reflect a strong bullish sentiment with potential for a short-term pullback due to overbought conditions.
Volatility Analysis:
- Bollinger Bands: The bands have been widening, indicating increased volatility in the stock price.
- Bollinger %B: The %B has been decreasing slightly, suggesting a possible consolidation phase.
- Average True Range (ATR): ATR has shown an uptrend, indicating rising volatility.
Key Observation: Volatility indicators suggest a mix of increased volatility and a potential consolidation phase.
Volume Analysis:
- On-Balance Volume (OBV): The OBV has been steadily increasing, indicating strong buying pressure.
- Chaikin Money Flow (CMF): CMF has been positive, reflecting buying interest in the stock.
Key Observation: Volume indicators support the bullish trend with consistent buying pressure.
Conclusion:
Based on the analysis of trend, momentum, volatility, and volume indicators, the stock price of STNG is likely to continue its upward trajectory in the coming days. The strong bullish trend, supported by positive momentum and volume, suggests further potential upside. However, given the overbought conditions in some momentum indicators, a short-term pullback or consolidation phase may occur before the uptrend resumes.
Key Conclusion: Upward movement is expected in the next few days, with a possibility of a short-term pullback due to overbought conditions.