Technical Analysis of STWD 2024-05-10
Overview:
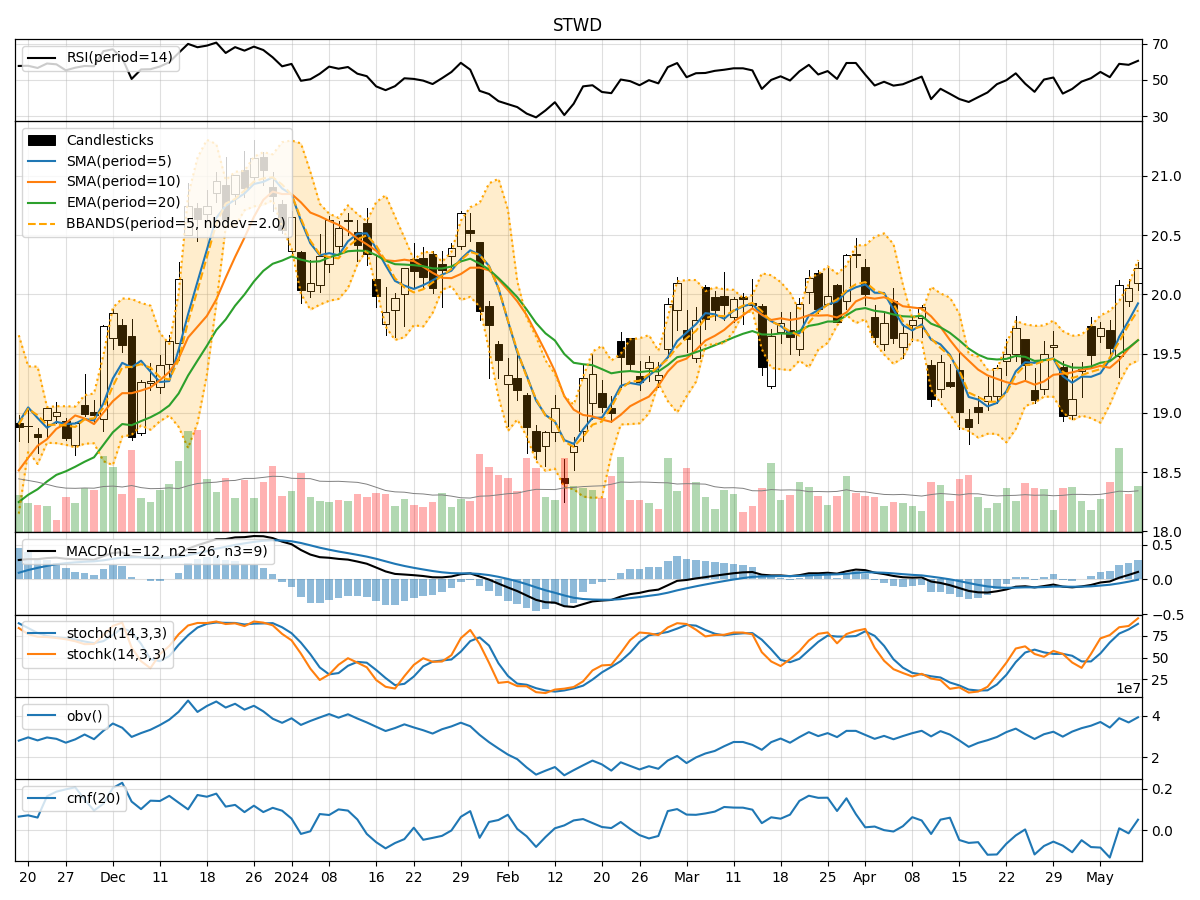
In analyzing the technical indicators for STWD over the last 5 days, we will delve into the trend, momentum, volatility, and volume indicators to provide a comprehensive outlook on the possible stock price movement in the coming days.
Trend Analysis:
- Moving Averages (MA): The 5-day Moving Average (MA) has been trending upwards, indicating a positive momentum in the short term.
- MACD: The Moving Average Convergence Divergence (MACD) has shown a consistent increase, with the MACD line crossing above the signal line, signaling a bullish trend.
- RSI: The Relative Strength Index (RSI) is in the neutral zone, suggesting a balanced market sentiment.
Momentum Analysis:
- Stochastic Oscillator: Both %K and %D lines of the Stochastic Oscillator are in the overbought region, indicating a potential reversal or consolidation.
- Williams %R: The Williams %R is close to the oversold territory, suggesting a possible buying opportunity.
Volatility Analysis:
- Bollinger Bands (BB): The stock price has been trading within the Bollinger Bands, indicating a period of consolidation.
- Volatility: The volatility has been relatively stable over the last 5 days, with no significant spikes.
Volume Analysis:
- On-Balance Volume (OBV): The OBV has shown mixed signals, with no clear trend in volume accumulation or distribution.
- Chaikin Money Flow (CMF): The CMF is slightly negative, indicating some selling pressure in the market.
Key Observations:
- The trend indicators suggest a bullish sentiment in the short term, supported by the positive MACD and moving averages.
- Momentum indicators show conflicting signals, with the Stochastic Oscillator in the overbought region and Williams %R nearing oversold levels.
- Volatility remains stable, indicating a period of consolidation without significant price swings.
- Volume indicators do not provide a clear direction, with OBV showing mixed signals and CMF slightly negative.
Conclusion:
Based on the analysis of the technical indicators, the stock price of STWD is likely to experience further upward movement in the coming days. The bullish trend indicated by the MACD and moving averages, coupled with the stable volatility, suggests a potential continuation of the positive momentum. Traders may consider buying opportunities in the short term, while also monitoring the overbought conditions highlighted by the Stochastic Oscillator. Overall, the outlook for STWD is bullish in the near future.