Technical Analysis of SUM 2024-05-10
Overview:
In analyzing the technical indicators for the stock of SUM over the last 5 days, we will delve into the trends, momentum, volatility, and volume aspects to provide a comprehensive outlook on the possible stock price movement in the coming days. By examining key indicators such as moving averages, MACD, RSI, Bollinger Bands, and OBV, we aim to offer valuable insights and predictions for potential price trends.
Trend Analysis:
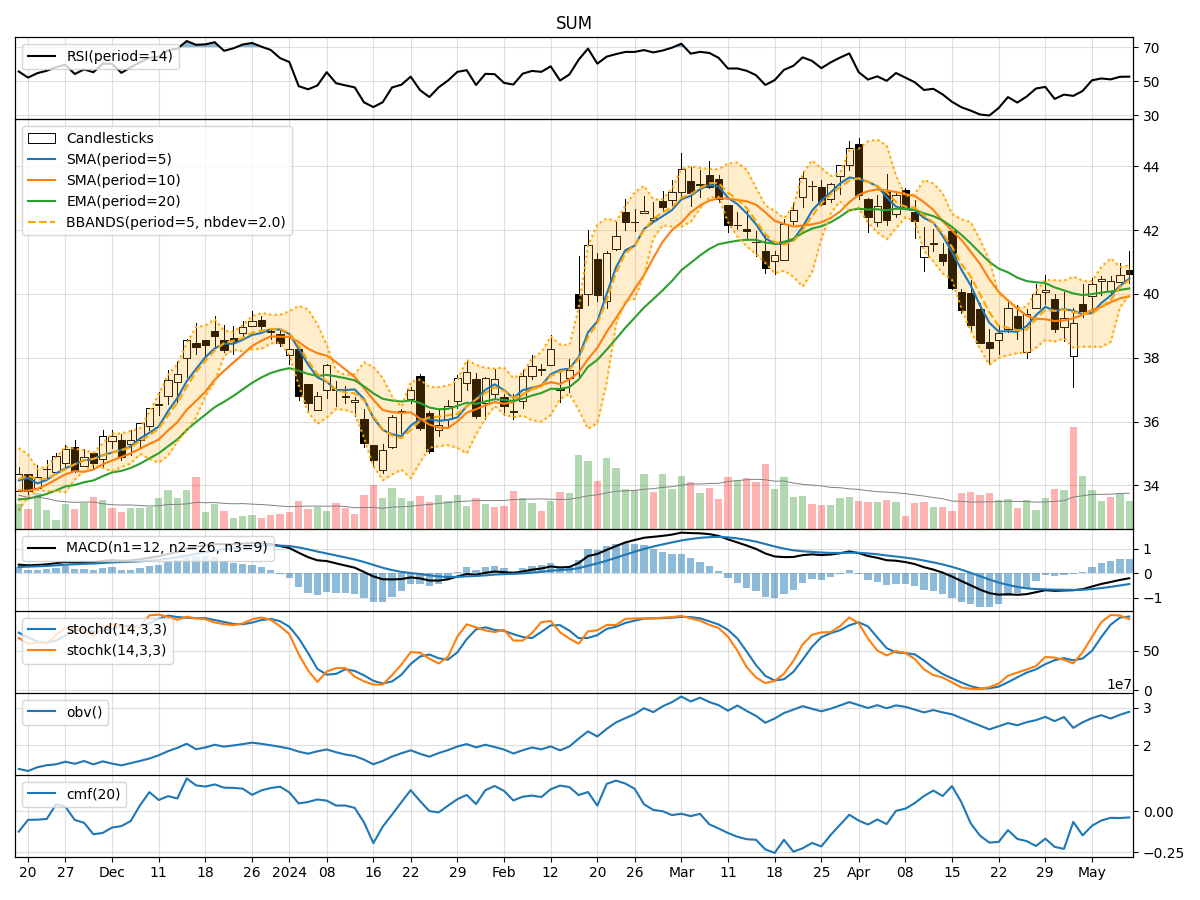
- Moving Averages (MA): The 5-day moving average has been consistently above the closing prices, indicating a short-term uptrend.
- MACD: The MACD line has been negative but converging towards the signal line, suggesting a potential bullish crossover.
- EMA: The exponential moving average has been trending upwards, reflecting a positive momentum in the stock price.
Momentum Analysis:
- RSI: The Relative Strength Index has been in the neutral zone, indicating a balanced momentum without extreme overbought or oversold conditions.
- Stochastic Oscillator: Both %K and %D have been in the overbought territory, signaling a potential reversal or consolidation.
- Williams %R: The Williams %R is in the oversold region, suggesting a possible buying opportunity.
Volatility Analysis:
- Bollinger Bands: The stock price has been trading within the bands, with the upper band acting as resistance and the lower band as support.
- Bollinger %B: The %B indicator is below 1, indicating that the stock price is trading below the upper Bollinger Band, potentially signaling a reversal.
- Bollinger Band Width: The band width has been narrowing, suggesting a decrease in volatility and a possible period of consolidation.
Volume Analysis:
- On-Balance Volume (OBV): The OBV indicator has been relatively flat, indicating a balance between buying and selling pressure.
- Chaikin Money Flow (CMF): The CMF has been negative, suggesting a net outflow of money from the stock.
Conclusion:
Based on the analysis of the technical indicators, the stock of SUM is showing signs of consolidation and sideways movement in the near term. The moving averages and EMA indicate a short-term uptrend, while the MACD suggests a potential bullish crossover. However, the overbought conditions in the Stochastic Oscillator and the negative CMF signal caution against immediate bullish bets. Therefore, it is advisable to exercise caution and wait for clearer signals before making any significant trading decisions.