Technical Analysis of SUPV 2024-05-10
Overview:
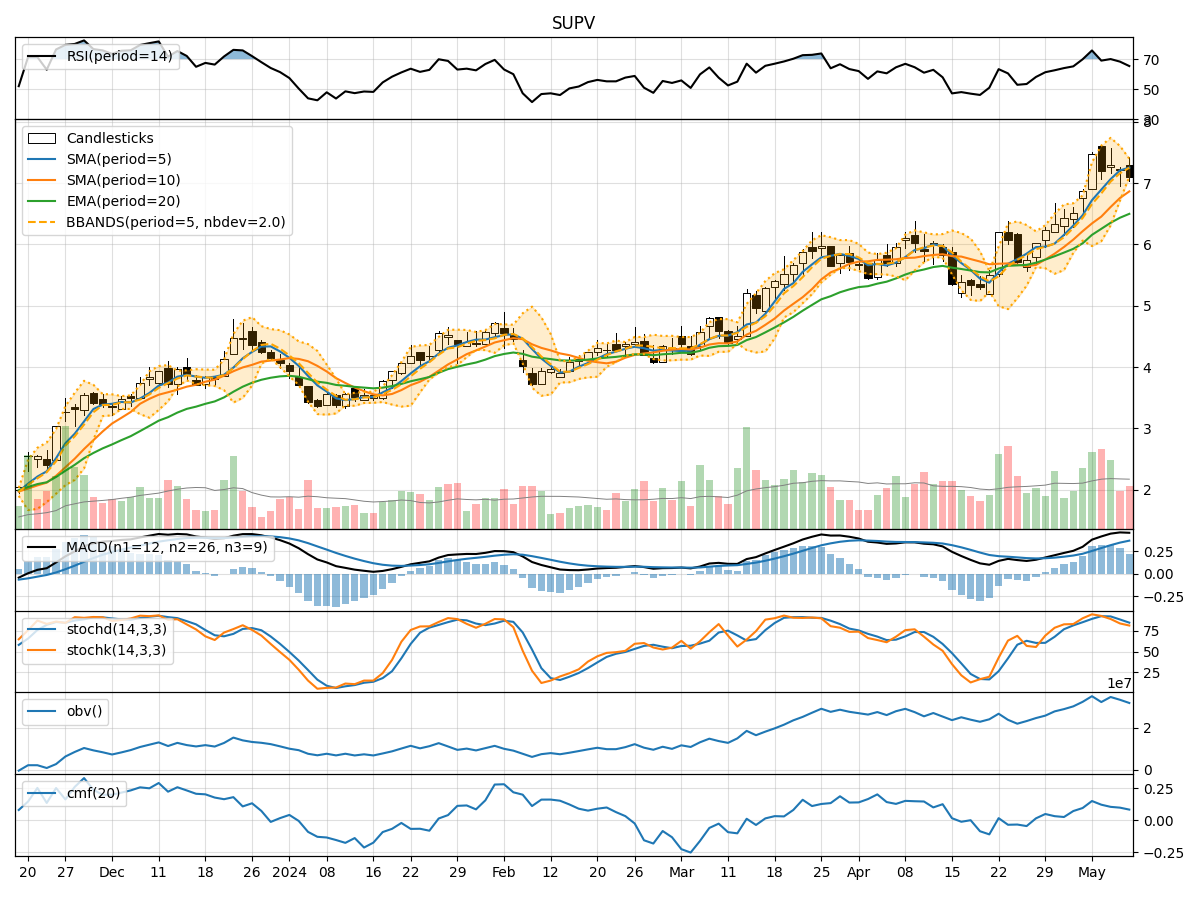
In analyzing the technical indicators for SUPV over the last 5 days, we will delve into the trend, momentum, volatility, and volume indicators to provide a comprehensive outlook on the possible stock price movement in the coming days.
Trend Analysis:
- Moving Averages (MA): The 5-day Moving Average (MA) has been consistently above the Simple Moving Average (SMA) and Exponential Moving Average (EMA), indicating a bullish trend.
- MACD: The MACD line has been above the signal line, with both lines showing an upward trend, suggesting bullish momentum.
- RSI: The Relative Strength Index (RSI) has been above 50, indicating bullish momentum.
Momentum Analysis:
- Stochastic Oscillator: Both %K and %D have been decreasing, moving towards the oversold territory, signaling a potential reversal in momentum.
- Williams %R: The Williams %R has been in the oversold region, indicating a potential buying opportunity.
Volatility Analysis:
- Bollinger Bands: The stock price has been trading within the Bollinger Bands, with the bands narrowing, suggesting a period of consolidation.
- Volatility: The volatility has been decreasing, indicating a potential decrease in price fluctuations.
Volume Analysis:
- On-Balance Volume (OBV): The OBV has been fluctuating, indicating indecision among investors.
- Chaikin Money Flow (CMF): The CMF has been positive but decreasing, suggesting a weakening buying pressure.
Conclusion:
Based on the analysis of the technical indicators, the stock is currently in a consolidation phase with a bullish bias. However, the momentum indicators are showing signs of a potential reversal in the short term, with the Stochastic Oscillator moving towards oversold levels. The narrowing Bollinger Bands and decreasing volatility also support the view of a possible price consolidation.
Recommendation:
Considering the overall technical picture, it is advisable to exercise caution in the short term. Traders may consider waiting for a clearer signal from the momentum indicators before making any significant trading decisions. Long-term investors can use any potential pullback as a buying opportunity to capitalize on the overall bullish trend.
Key Takeaways:
- Short Term: Potential for a short-term pullback due to momentum indicators.
- Long Term: Overall bullish bias remains intact.
- Risk Management: Implement stop-loss orders to protect against sudden price fluctuations.
By carefully monitoring the key technical indicators and market dynamics, investors can make well-informed decisions to navigate the stock market effectively.