Technical Analysis of SWK 2024-05-10
Overview:
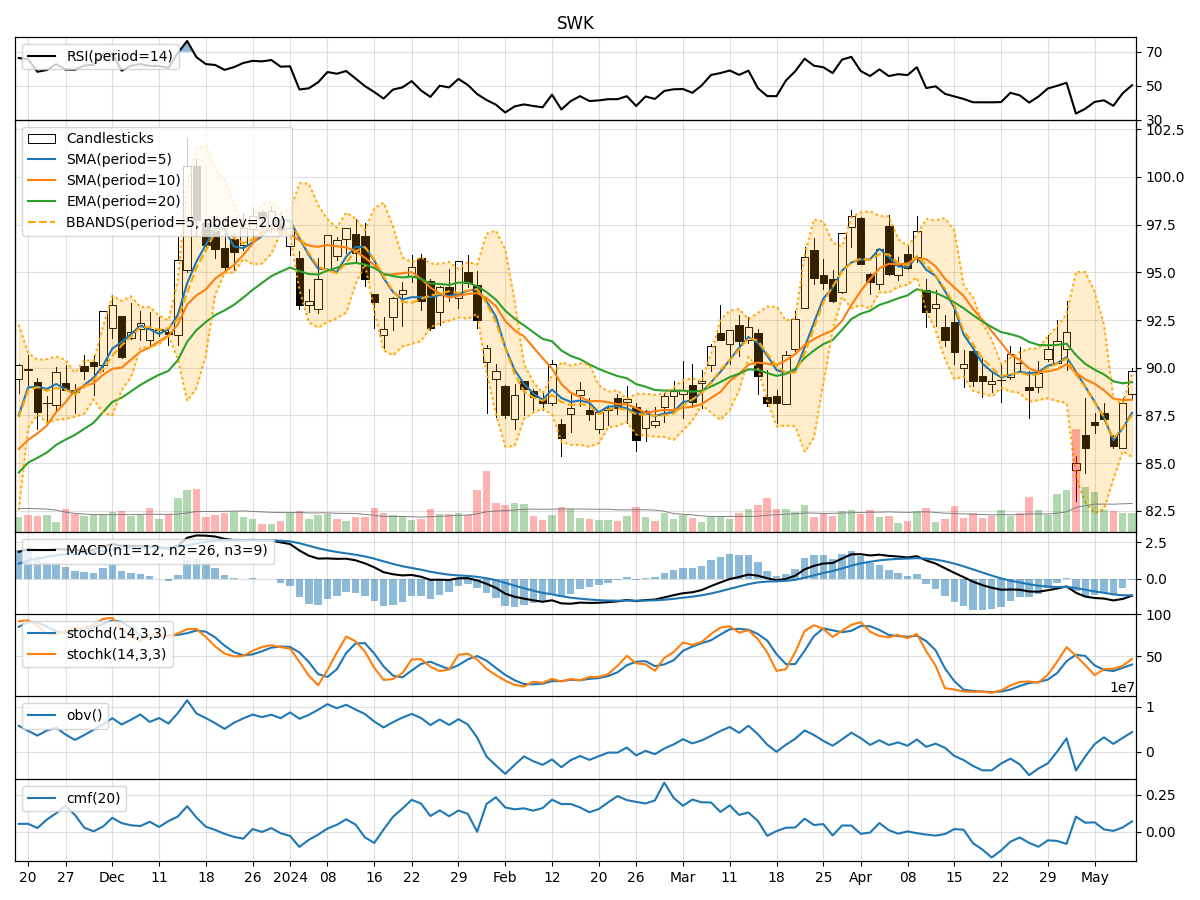
In analyzing the technical indicators for SWK over the last 5 days, we will delve into the trend, momentum, volatility, and volume indicators to provide a comprehensive outlook on the possible stock price movement in the coming days.
Trend Analysis:
- Moving Averages (MA): The 5-day MA has been consistently below the closing prices, indicating a short-term downtrend.
- MACD: The MACD line has been below the signal line, suggesting a bearish momentum.
- EMA: The EMA has been declining, reflecting a weakening trend.
Key Observation: The trend indicators point towards a bearish sentiment in the short term.
Momentum Analysis:
- RSI: The RSI has been fluctuating around the 50 level, indicating indecision in the market.
- Stochastic Oscillator: Both %K and %D have been rising, suggesting a potential shift towards bullish momentum.
- Williams %R: The indicator has been moving towards oversold territory, signaling a possible reversal.
Key Observation: Momentum indicators show a mixed outlook, with a slight inclination towards a bullish reversal.
Volatility Analysis:
- Bollinger Bands (BB): The bands have been narrowing, indicating decreasing volatility.
- Bollinger %B: The %B has been hovering around 0.5, reflecting a balanced market sentiment.
Key Observation: Volatility indicators suggest a sideways movement with a neutral stance.
Volume Analysis:
- On-Balance Volume (OBV): The OBV has shown an overall increase, indicating accumulation by investors.
- Chaikin Money Flow (CMF): The CMF has been positive, signaling buying pressure in the market.
Key Observation: Volume indicators support a bullish sentiment with increasing buying interest.
Conclusion:
Based on the analysis of the technical indicators, the next few days for SWK could see a mixed price movement. The trend indicators point towards a bearish outlook, while momentum indicators suggest a potential bullish reversal. Volatility indicators indicate a sideways trend, and volume indicators support a bullish sentiment.
Recommendation:
Considering the overall analysis, it is advisable to exercise caution in trading SWK in the coming days. Traders may consider short-term bearish positions based on the trend indicators, while also being mindful of a potential bullish reversal indicated by momentum indicators. Investors could monitor the market closely for confirmation of a clear trend before making significant decisions.
Disclaimer:
This analysis is based solely on technical indicators and does not take into account fundamental factors or external market influences. It is essential to conduct thorough research and consider multiple perspectives before making any investment decisions.