Technical Analysis of SXC 2024-05-31
Overview:
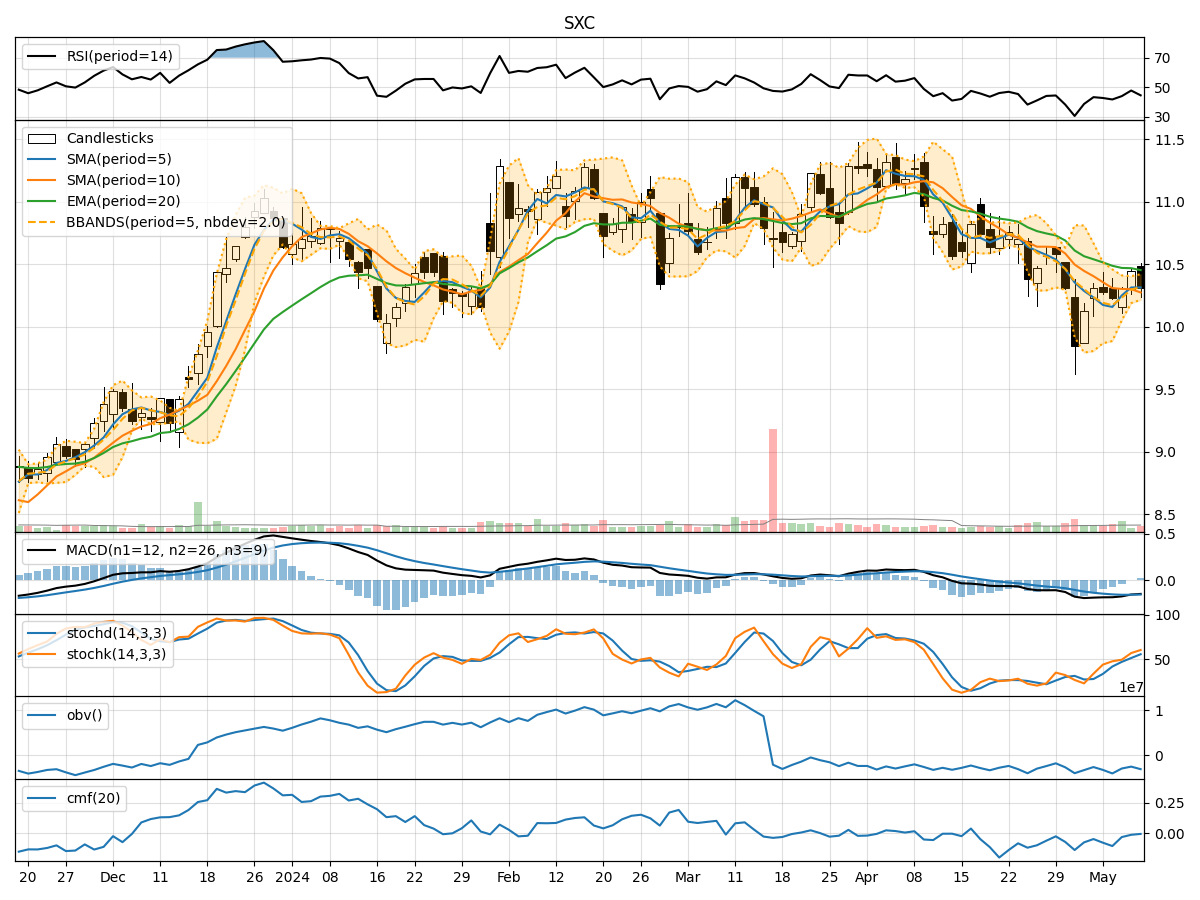
In analyzing the technical indicators for SXC over the last 5 days, we will delve into the trends, momentum, volatility, and volume indicators to provide a comprehensive outlook on the possible stock price movement. By examining these key aspects, we aim to offer valuable insights and predictions for the upcoming days.
Trend Analysis:
- Moving Averages (MA): The 5-day Moving Average (MA) has been relatively stable around the closing prices, indicating a consistent trend.
- MACD and Signal Line: The MACD has shown fluctuations but has generally remained close to the signal line, suggesting a balanced momentum.
- Relative Strength Index (RSI): The RSI values have fluctuated but have not reached extreme levels, indicating a neutral sentiment.
Momentum Analysis:
- Stochastic Oscillator: The Stochastic Oscillator has shown a downward trend, moving towards oversold territory.
- Williams %R (Willr): The Williams %R indicator has been consistently in oversold territory, signaling a potential reversal.
Volatility Analysis:
- Bollinger Bands (BB): The Bollinger Bands have narrowed, indicating decreasing volatility and a potential breakout.
Volume Analysis:
- On-Balance Volume (OBV): The OBV has shown a slight decrease, suggesting some selling pressure.
- Chaikin Money Flow (CMF): The CMF has been negative, indicating a bearish money flow.
Key Observations:
- The trend indicators suggest a neutral to slightly bearish outlook with stable moving averages and fluctuating MACD.
- Momentum indicators point towards a potential reversal as the Stochastic Oscillator and Williams %R indicate oversold conditions.
- Volatility has decreased as per the Bollinger Bands, signaling a possible consolidation phase.
- Volume indicators show a slight decrease in buying pressure based on OBV and bearish money flow according to CMF.
Conclusion:
Based on the analysis of the technical indicators, the next few days for SXC could see further downward movement in the stock price. The momentum indicators suggest a potential reversal, while the volatility indicators point towards consolidation. The volume indicators also support a bearish outlook. Therefore, it is advisable to exercise caution and consider potential short-term selling opportunities or wait for a clearer trend confirmation before making any significant investment decisions.