Technical Analysis of T 2024-05-10
Overview:
In analyzing the provided technical indicators for the last 5 days, we will delve into the trend, momentum, volatility, and volume indicators to forecast the possible stock price movement for the next few days. By examining these key aspects, we aim to provide a comprehensive and insightful prediction backed by data-driven analysis.
Trend Indicators:
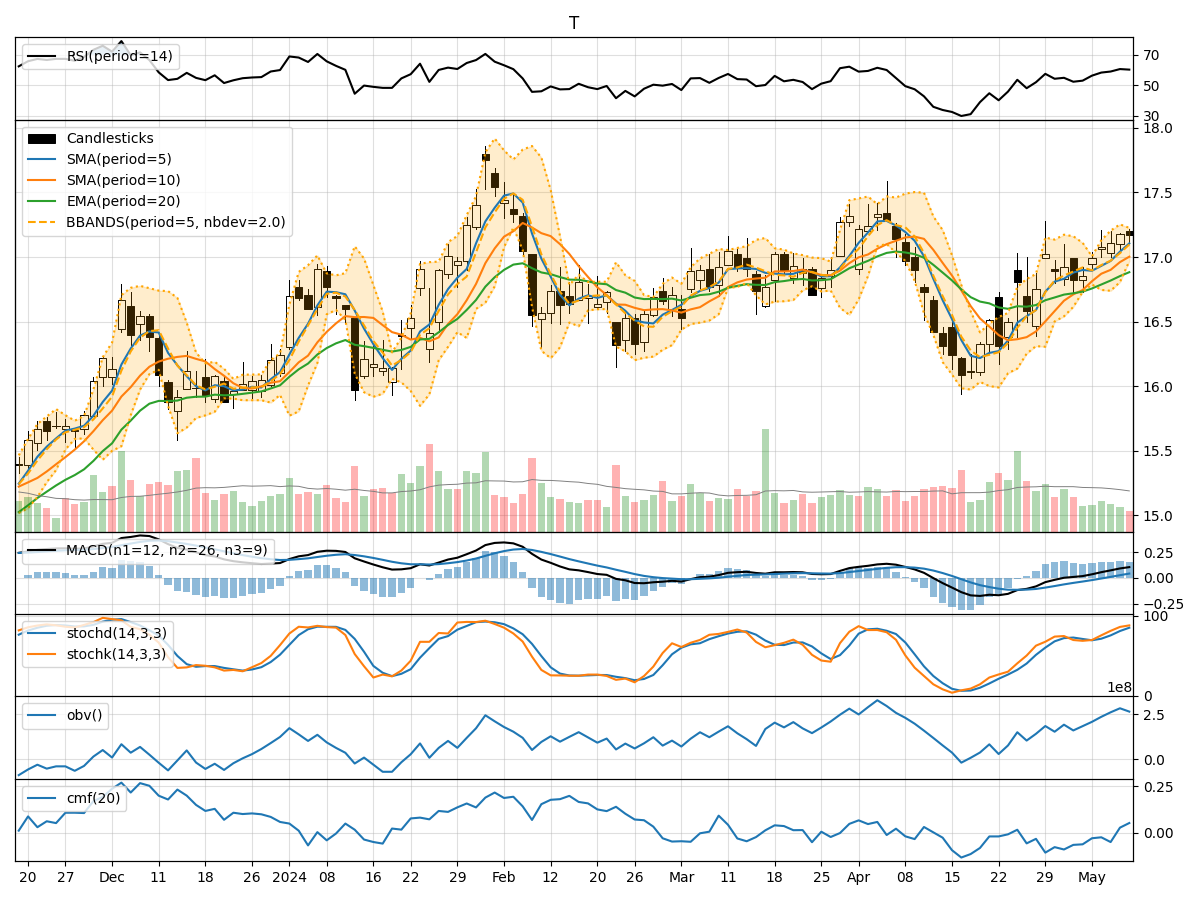
- Moving Averages (MA): The 5-day MA has been consistently rising, indicating a bullish trend in the short term.
- MACD: The MACD line has been above the signal line, suggesting positive momentum.
- EMA: The EMA has been trending upwards, supporting the bullish sentiment.
Key Observation: The trend indicators collectively point towards an upward trend in the stock price.
Momentum Indicators:
- RSI: The RSI has been increasing, but it is not in overbought territory yet, indicating room for further upside.
- Stochastic Oscillator: Both %K and %D have been rising, reflecting increasing buying pressure.
- Williams %R: The indicator is not in oversold or overbought territory, suggesting a balanced momentum.
Key Observation: Momentum indicators signal a bullish sentiment with potential for further upside.
Volatility Indicators:
- Bollinger Bands (BB): The bands have been widening, indicating increased volatility.
- BB %B: The %B is below 1, suggesting the stock is trading below the upper band.
- BB Width: The widening of the bands indicates a potential increase in volatility.
Key Observation: Volatility is on the rise, which could lead to larger price swings in the near term.
Volume Indicators:
- On-Balance Volume (OBV): The OBV has been increasing, indicating accumulation by investors.
- Chaikin Money Flow (CMF): The CMF has been positive, signaling buying pressure.
Key Observation: Volume indicators support the bullish outlook, indicating strong buying interest in the stock.
Conclusion:
Based on the analysis of the trend, momentum, volatility, and volume indicators, the overall outlook for the stock is bullish. The trend is upward, momentum is positive, volatility is increasing, and volume is supportive of further price appreciation. Therefore, the next few days are likely to see the stock price continue its upward trajectory.
Recommendation:
Considering the bullish signals across all indicators, it is advisable to consider buying or holding onto the stock for potential gains in the near future. However, it is essential to monitor the indicators regularly for any signs of reversal or divergence from the current trend.