Technical Analysis of TBBB 2024-05-10
Overview:
In analyzing the technical indicators for TBBB stock over the last 5 days, we will delve into the trend, momentum, volatility, and volume indicators to provide a comprehensive outlook on the possible stock price movement in the coming days. By examining key metrics such as moving averages, MACD, RSI, Bollinger Bands, and OBV, we aim to offer valuable insights and predictions for potential investors.
Trend Indicators:
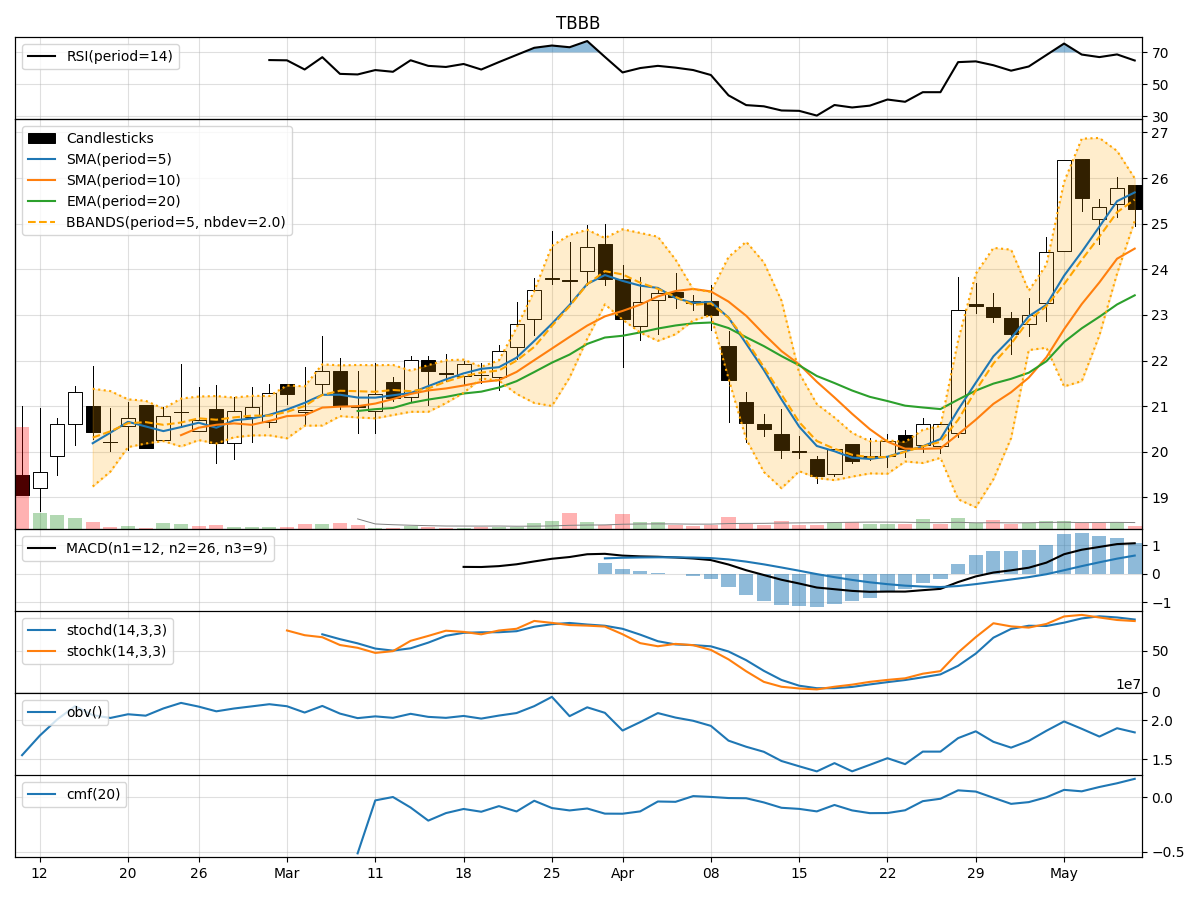
- Moving Averages (MA): The 5-day MA has been consistently rising, indicating a bullish trend in the short term.
- MACD: The MACD line has been above the signal line, suggesting positive momentum.
- EMA: The EMA has been trending upwards, supporting the bullish sentiment.
Momentum Indicators:
- RSI: The RSI has been fluctuating but generally staying above 50, indicating bullish momentum.
- Stochastic Oscillator: Both %K and %D have been in the overbought territory, signaling a potential reversal.
- Williams %R: The indicator has been in the oversold region, suggesting a possible buying opportunity.
Volatility Indicators:
- Bollinger Bands: The stock price has been trading within the bands, indicating normal volatility.
- Bollinger %B: The %B indicator has been fluctuating around 0.5, suggesting a balanced market sentiment.
Volume Indicators:
- On-Balance Volume (OBV): The OBV has been fluctuating, indicating mixed buying and selling pressure.
- Chaikin Money Flow (CMF): The CMF has been positive, suggesting accumulation by investors.
Key Observations:
- The trend indicators point towards a bullish sentiment in the short term.
- Momentum indicators show mixed signals with potential for a reversal in the stochastic oscillator.
- Volatility remains relatively stable, indicating a lack of significant price fluctuations.
- Volume indicators suggest a balanced buying and selling pressure with a slight inclination towards accumulation.
Conclusion:
Based on the analysis of the technical indicators, the next few days for TBBB stock are likely to see continued upward movement. The bullish trend supported by moving averages and MACD, coupled with positive momentum indicated by RSI, suggests a favorable outlook for the stock price. While some caution is warranted due to the overbought levels in the stochastic oscillator, overall market sentiment remains positive. Investors may consider buying opportunities in the short term.