Technical Analysis of TDC 2024-05-10
Overview:
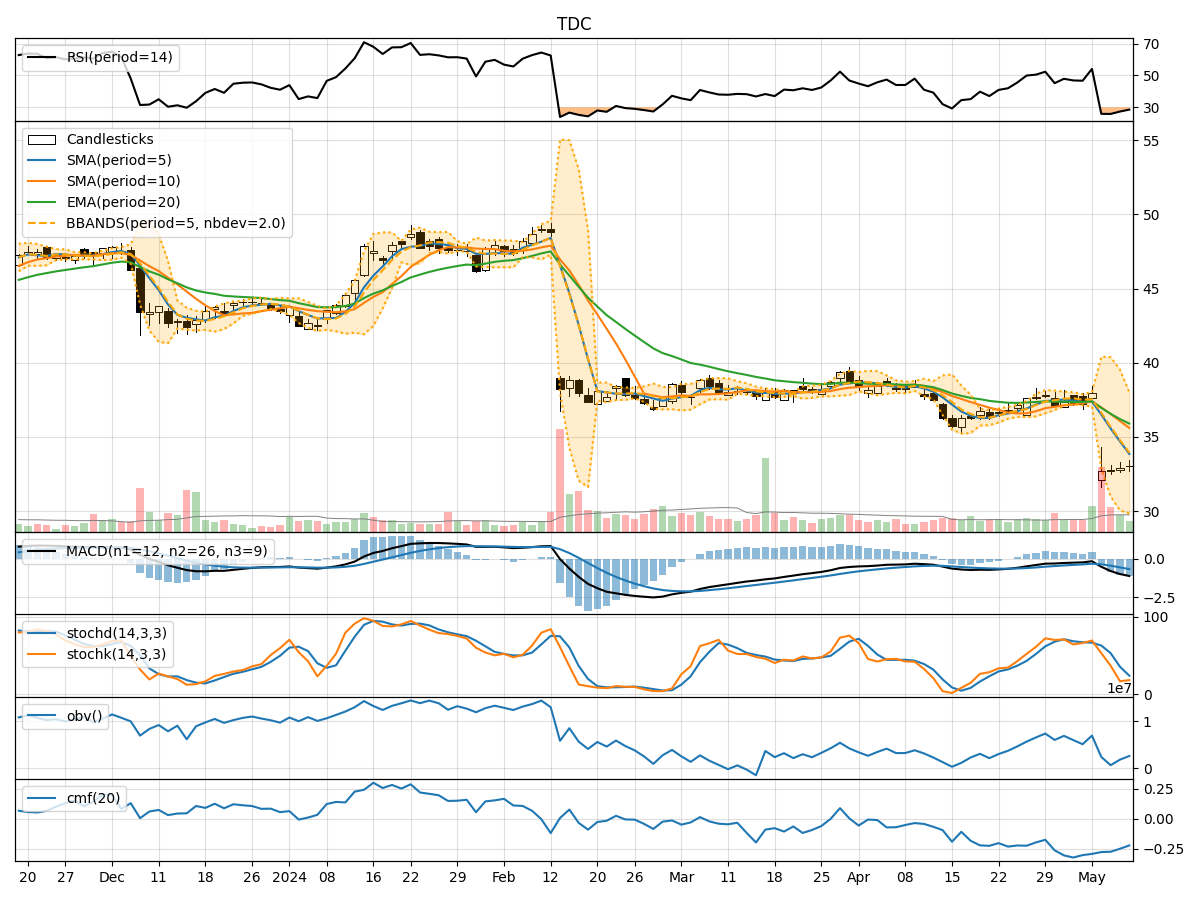
In analyzing the technical indicators for TDC over the last 5 days, we will delve into the trend, momentum, volatility, and volume indicators to provide a comprehensive outlook on the possible stock price movement in the coming days. By examining these key indicators, we aim to offer valuable insights and predictions for informed decision-making.
Trend Analysis:
- Moving Averages (MA): The 5-day moving average has been consistently decreasing, indicating a downward trend in the stock price.
- MACD: The MACD line has been negative and decreasing, suggesting a bearish momentum in the stock.
- EMA: The exponential moving average has also been declining, reinforcing the bearish sentiment in the short term.
Momentum Analysis:
- RSI: The Relative Strength Index has been relatively low, indicating a lack of strong buying momentum in the stock.
- Stochastic Oscillator: Both %K and %D have been in oversold territory, signaling a potential reversal or bounce in the stock price.
- Williams %R: The Williams %R is deeply oversold, suggesting a possible upcoming price correction.
Volatility Analysis:
- Bollinger Bands: The Bollinger Bands have been narrowing, indicating decreasing volatility in the stock price.
- Bollinger %B: The %B indicator is below 0.5, suggesting the stock is trading below the lower Bollinger Band and may be oversold.
Volume Analysis:
- On-Balance Volume (OBV): The OBV has been consistently negative, indicating selling pressure in the stock.
- Chaikin Money Flow (CMF): The CMF has been negative, reflecting a lack of buying interest in the stock.
Key Observations:
- The stock is currently in a downtrend based on moving averages and MACD.
- Momentum indicators suggest the stock may be oversold and due for a potential reversal.
- Volatility has been decreasing, indicating a lack of significant price movements.
- Volume indicators show selling pressure and a lack of buying interest in the stock.
Conclusion:
Based on the analysis of the technical indicators, the next few days' possible stock price movement for TDC is likely to see a short-term bounce or reversal as the stock is currently oversold. However, the overall trend remains bearish, and any upside potential may be limited. Traders should exercise caution and consider waiting for confirmation of a trend reversal before considering long positions.