Technical Analysis of TDCX 2024-05-10
Overview:
In analyzing the technical indicators for TDCX over the last 5 days, we will delve into the trends, momentum, volatility, and volume indicators to provide a comprehensive outlook on the possible stock price movement. By examining these key aspects, we aim to offer valuable insights and predictions for the upcoming days.
Trend Analysis:
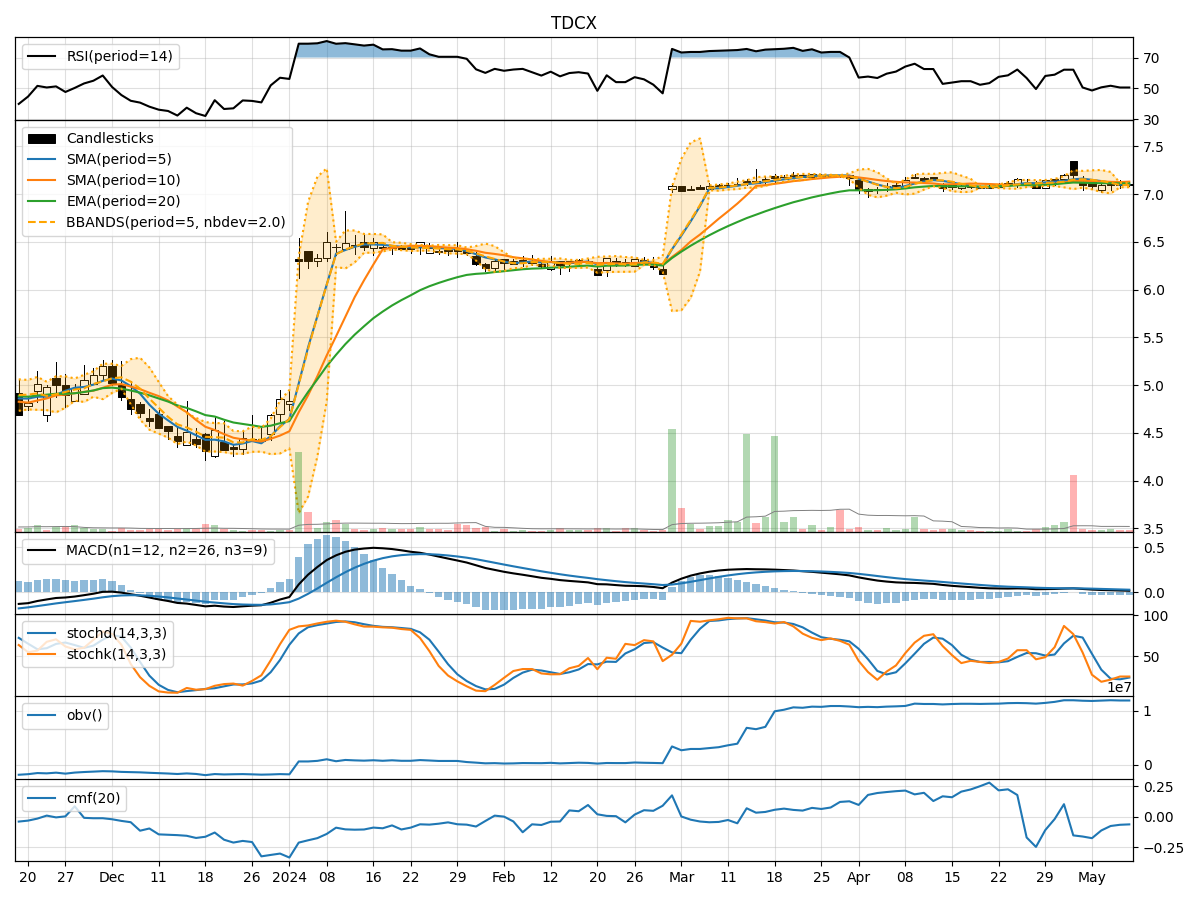
- Moving Averages (MA): The 5-day MA has been slightly below the closing prices, indicating a short-term downtrend.
- MACD: The MACD line has been positive but decreasing, while the MACD Histogram has been negative and declining, suggesting a weakening bullish momentum.
Momentum Analysis:
- RSI: The RSI has been hovering around the neutral zone, indicating a lack of strong buying or selling pressure.
- Stochastic Oscillator: Both %K and %D have been relatively low, signaling a potential oversold condition.
Volatility Analysis:
- Bollinger Bands (BB): The stock price has been trading within the lower Bollinger Band, suggesting a period of low volatility.
- Bollinger %B: The %B indicator has been below 0.2, indicating the stock is oversold.
Volume Analysis:
- On-Balance Volume (OBV): The OBV has been relatively flat, indicating a balance between buying and selling pressure.
- Chaikin Money Flow (CMF): The CMF has been negative, suggesting outflow of money from the stock.
Key Observations:
- The stock is currently in a short-term downtrend based on moving averages.
- Momentum indicators show a lack of strong buying or selling pressure.
- Volatility is low, with the stock trading near the lower Bollinger Band.
- Volume indicators suggest a balance between buying and selling pressure, with a slight outflow of money.
Conclusion:
Based on the analysis of technical indicators, the stock is likely to continue its sideways movement in the upcoming days. The lack of strong trends in both price and momentum, coupled with low volatility and balanced volume, indicates a period of consolidation. Traders may expect the stock price to remain range-bound without significant directional bias. It is advisable to closely monitor key support and resistance levels for potential breakout opportunities in the future.