Technical Analysis of TGI 2024-05-31
Overview:
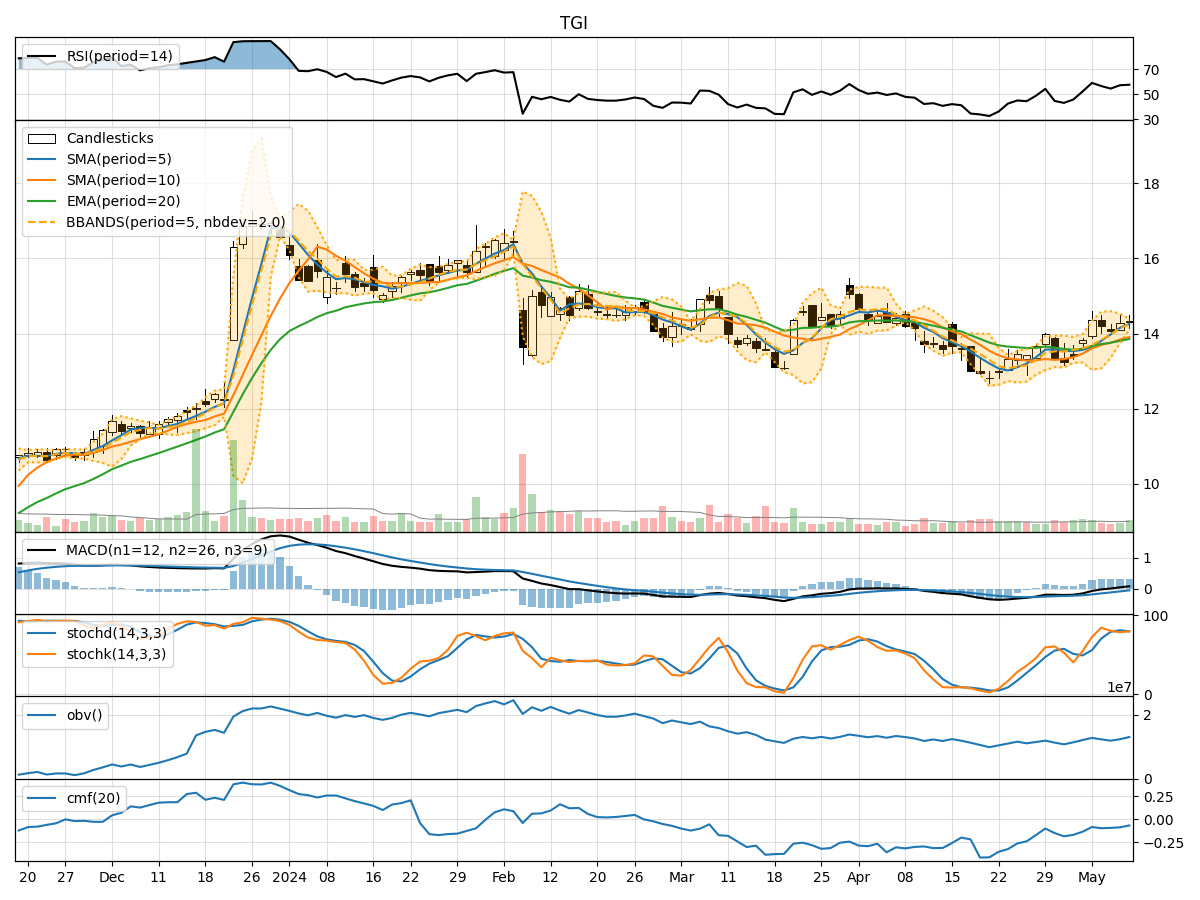
In analyzing the technical indicators for TGI over the last 5 days, we will delve into the trend, momentum, volatility, and volume indicators to provide a comprehensive outlook on the possible stock price movement in the coming days.
Trend Indicators:
- Moving Averages (MA): The 5-day MA has been consistently below the closing price, indicating a short-term downtrend.
- MACD: The MACD line has been positive but decreasing, while the MACD Histogram has been negative, suggesting a potential reversal or consolidation.
- EMA: The EMA has been declining, reflecting a bearish sentiment in the short to medium term.
Momentum Indicators:
- RSI: The RSI has been hovering around the neutral zone, indicating a lack of strong momentum in either direction.
- Stochastic Oscillator: Both %K and %D have been fluctuating around the mid-level, suggesting indecision in the market.
- Williams %R: The indicator has been in the oversold territory, signaling a potential buying opportunity.
Volatility Indicators:
- Bollinger Bands (BB): The bands have been narrowing, indicating decreasing volatility and a possible period of consolidation.
- BB %B: The %B has been declining, suggesting a shift towards the lower band and a potential oversold condition.
Volume Indicators:
- On-Balance Volume (OBV): The OBV has been negative, indicating distribution and selling pressure in the stock.
- Chaikin Money Flow (CMF): The CMF has been negative, reflecting a lack of buying interest and potential weakness in the stock.
Key Observations and Opinions:
- Trend: The trend indicators point towards a short-term bearish bias, with the potential for a reversal or consolidation in the near future.
- Momentum: Momentum indicators suggest a lack of clear direction, with a possibility of a shift towards a buying opportunity based on the Williams %R.
- Volatility: Volatility indicators signal a period of decreasing volatility and a potential consolidation phase.
- Volume: Volume indicators indicate selling pressure and a lack of significant buying interest in the stock.
Conclusion:
Based on the analysis of the technical indicators, the next few days for TGI could see sideways movement or consolidation with a slight bearish bias. Traders and investors should closely monitor key levels such as support and resistance to gauge the potential breakout or breakdown in the stock price. It is advisable to wait for more clarity in the market before taking any significant trading positions.