Technical Analysis of TGLS 2024-05-10
Overview:
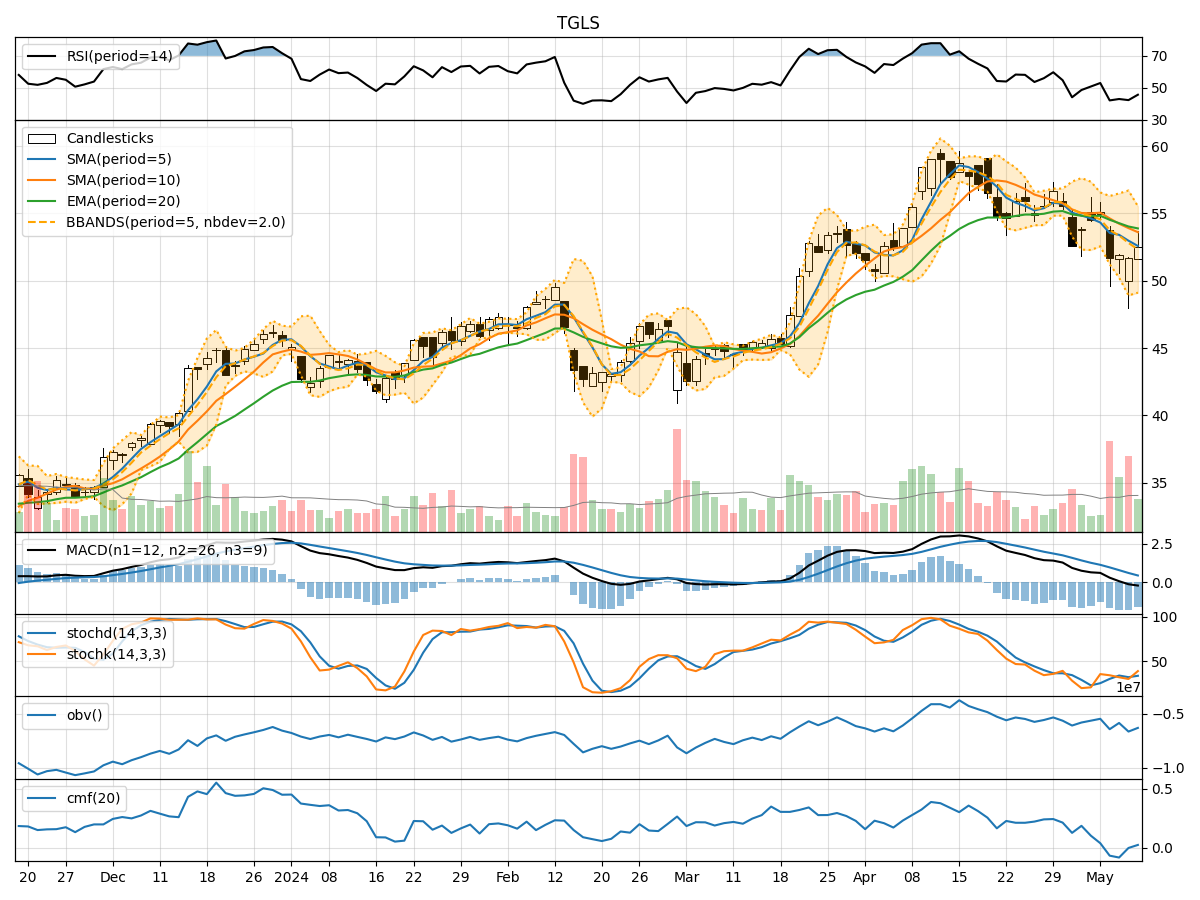
In analyzing the technical indicators for TGLS over the last 5 days, we will delve into the trend, momentum, volatility, and volume indicators to provide a comprehensive outlook on the possible stock price movement in the coming days. By examining these key aspects, we aim to offer valuable insights and predictions for potential investors.
Trend Indicators:
- Moving Averages (MA): The 5-day MA has been consistently below the closing prices, indicating a short-term downtrend.
- MACD: The MACD line has been below the signal line, suggesting a bearish momentum.
- EMA: The EMA has been declining, further supporting the bearish trend.
Key Observation: The trend indicators point towards a bearish sentiment in the stock price movement.
Momentum Indicators:
- RSI: The RSI has been decreasing, indicating a weakening momentum.
- Stochastic Oscillator: Both %K and %D have been trending downwards, signaling a bearish momentum.
- Williams %R: The indicator has been in the oversold territory, suggesting a potential reversal.
Key Observation: Momentum indicators align with the bearish trend, indicating a lack of strong buying pressure.
Volatility Indicators:
- Bollinger Bands: The stock price has been trading within the lower Bollinger Band, indicating lower volatility.
- Bollinger %B: The %B is below 1, suggesting the stock is trading near the lower band.
Key Observation: Volatility indicators reflect a period of consolidation with limited price movement.
Volume Indicators:
- On-Balance Volume (OBV): The OBV has been fluctuating, indicating indecision among investors.
- Chaikin Money Flow (CMF): The CMF has been negative, suggesting outflow of money from the stock.
Key Observation: Volume indicators show a lack of strong buying interest and potential selling pressure.
Conclusion:
Based on the analysis of the technical indicators, the overall outlook for TGLS in the next few days is bearish. The trend indicators, momentum indicators, and volume indicators all point towards a continuation of the current downtrend with limited volatility. Investors should exercise caution and consider waiting for a more favorable entry point before considering any long positions. Short-term traders may find opportunities to capitalize on potential downside movements.
Key Takeaways:
- Direction: Downward
- Recommendation: Exercise Caution
- Potential Strategy: Wait for a Better Entry Point
By carefully considering the interplay of trend, momentum, volatility, and volume indicators, investors can make more informed decisions in navigating the market dynamics of TGLS.