Technical Analysis of THG 2024-05-10
Overview:
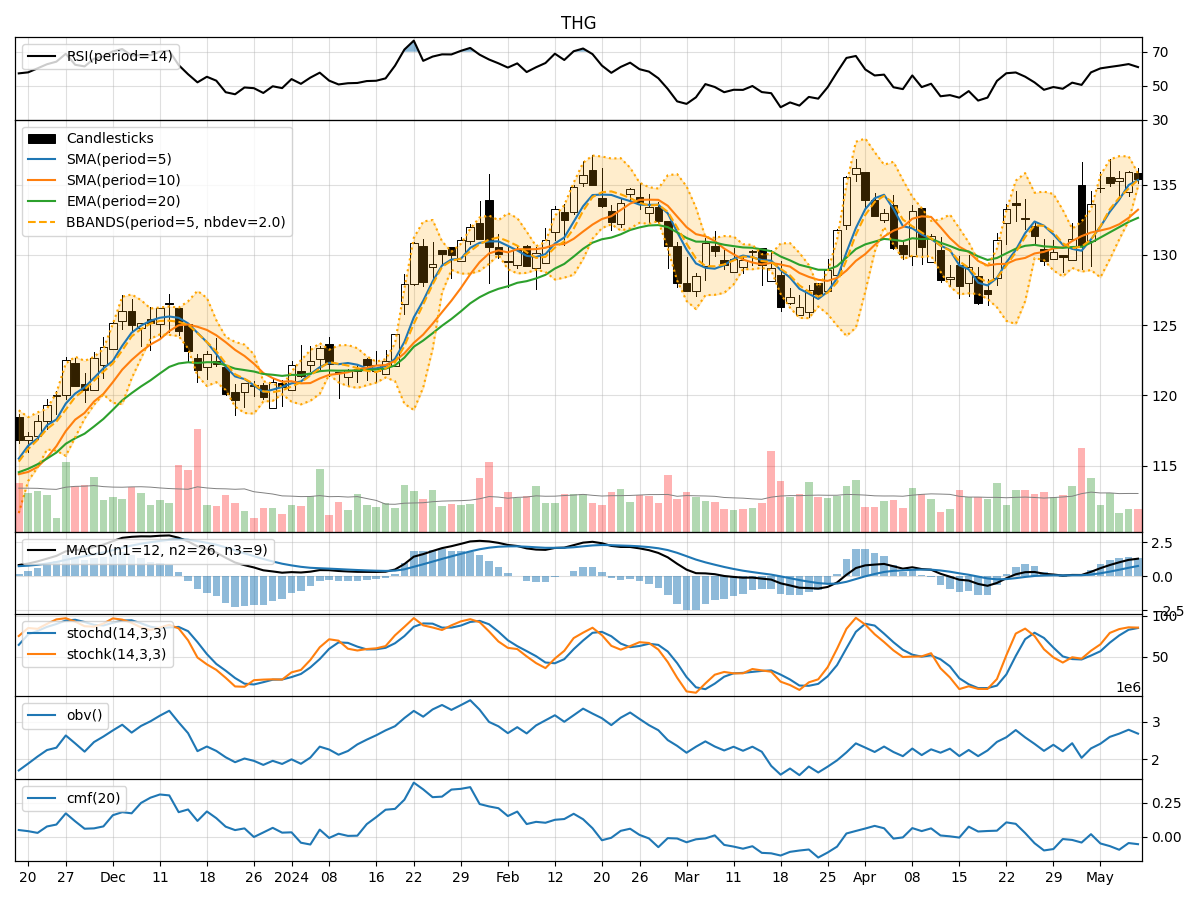
In analyzing the technical indicators for THG over the last 5 days, we will delve into the trend, momentum, volatility, and volume indicators to provide a comprehensive outlook on the possible stock price movement in the coming days.
Trend Analysis:
- Moving Averages (MA): The 5-day Moving Average has been consistently above the Simple Moving Average (SMA) and Exponential Moving Average (EMA), indicating a bullish trend.
- MACD: The MACD line has been consistently above the signal line, with both lines showing an upward trend, suggesting bullish momentum.
Momentum Analysis:
- RSI: The Relative Strength Index (RSI) has been trending upwards, indicating increasing buying pressure.
- Stochastic Oscillator: Both %K and %D lines of the Stochastic Oscillator have been in the overbought zone, suggesting a strong bullish momentum.
Volatility Analysis:
- Bollinger Bands (BB): The stock price has been trading within the upper Bollinger Band, indicating high volatility.
Volume Analysis:
- On-Balance Volume (OBV): The OBV has shown mixed signals, with some days experiencing selling pressure and others showing accumulation.
- Chaikin Money Flow (CMF): The CMF has been negative, indicating a lack of buying pressure.
Key Observations:
- The trend indicators suggest a strong bullish sentiment, supported by the moving averages and MACD.
- Momentum indicators like RSI and Stochastic Oscillator point towards a continuation of the bullish trend.
- Volatility remains high as indicated by the Bollinger Bands, potentially leading to significant price swings.
- Volume indicators show mixed signals, with OBV reflecting some selling pressure and CMF indicating a lack of significant buying interest.
Conclusion:
Based on the analysis of the technical indicators, the stock price of THG is likely to continue its upward momentum in the next few days. The bullish trend supported by moving averages and MACD, coupled with positive momentum indicators like RSI and Stochastic Oscillator, suggests a favorable outlook for the stock. However, investors should remain cautious of the high volatility indicated by the Bollinger Bands and monitor volume indicators for any shifts in buying or selling pressure. Overall, the technical analysis points towards a bullish view for THG in the upcoming trading sessions.