Technical Analysis of THO 2024-05-10
Overview:
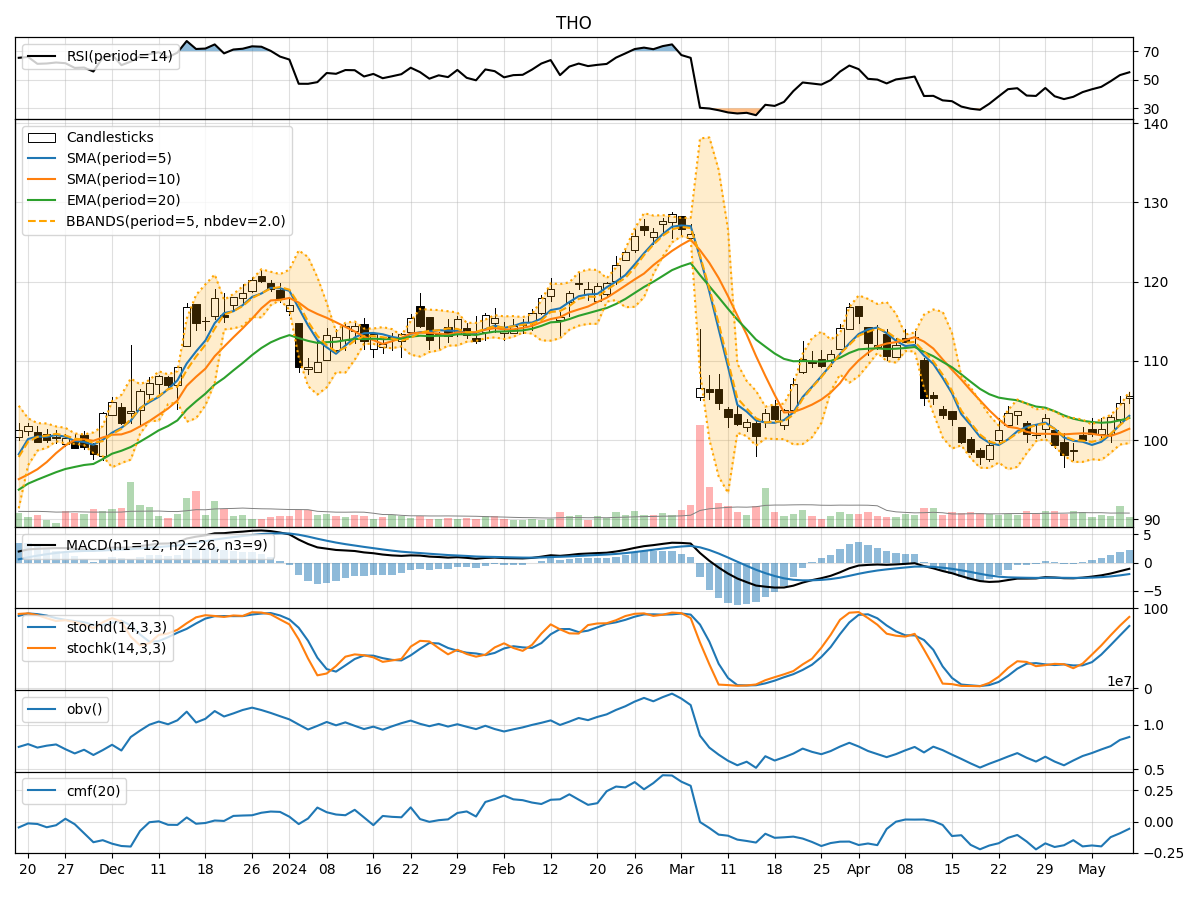
In analyzing the technical indicators for THO over the last 5 days, we will delve into the trend, momentum, volatility, and volume indicators to provide a comprehensive outlook on the possible stock price movement in the coming days.
Trend Indicators:
- Moving Averages (MA): The 5-day MA has been consistently rising, indicating a bullish trend.
- MACD: The MACD line has been above the signal line, suggesting a bullish momentum.
- EMA: The EMA has been trending upwards, supporting the bullish sentiment.
Momentum Indicators:
- RSI: The RSI has been increasing, showing strengthening momentum.
- Stochastic Oscillator: Both %K and %D have been rising, indicating increasing buying pressure.
- Williams %R: The indicator has been moving towards oversold territory, suggesting a potential reversal.
Volatility Indicators:
- Bollinger Bands: The stock price has been trading above the middle band, indicating an uptrend.
- Bollinger %B: The %B value has been fluctuating but remains above 0.5, indicating bullish momentum.
Volume Indicators:
- On-Balance Volume (OBV): The OBV has been declining, signaling potential distribution.
- Chaikin Money Flow (CMF): The CMF has been negative, indicating selling pressure.
Key Observations:
- Trend: The trend indicators suggest a strong bullish sentiment.
- Momentum: Momentum indicators support the bullish outlook with increasing buying pressure.
- Volatility: Volatility indicators show an uptrend with bullish momentum.
- Volume: Volume indicators, particularly OBV and CMF, indicate a divergence with the bullish trend.
Conclusion:
Based on the analysis of the technical indicators, the next few days' possible stock price movement for THO is likely to continue upwards with a bullish bias. However, caution is advised due to the divergence in volume indicators, which could potentially lead to a consolidation or a minor pullback before resuming the uptrend. Traders should monitor the price action closely for any signs of weakness or reversal in the bullish trend.