Technical Analysis of TIXT 2024-05-10
Overview:
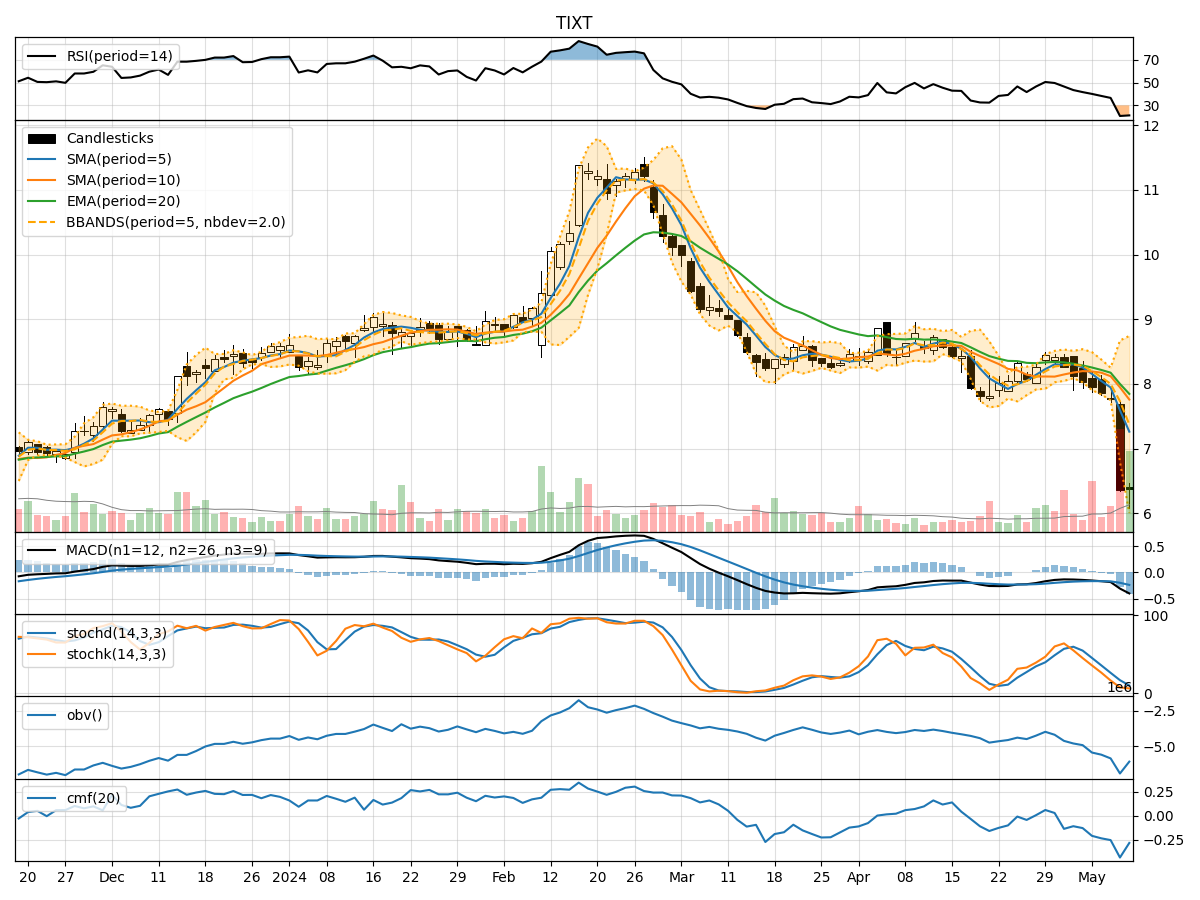
In the last 5 trading days, TIXT stock has shown a consistent downward trend in both price and volume. The moving averages (MA) have been declining, indicating a bearish trend. Momentum indicators such as RSI and Stochastic Oscillator are also in oversold territory, suggesting a potential reversal. Volatility has been decreasing, and volume indicators like OBV and CMF are showing negative values, reflecting selling pressure.
Trend Analysis:
- Moving Averages (MA): The 5-day MA has been consistently below the longer-term SMAs and EMAs, indicating a bearish trend.
- MACD: The MACD line has been below the signal line, with negative values for MACD Histogram, signaling a bearish momentum.
Momentum Analysis:
- RSI: RSI has been below 30, indicating oversold conditions and a potential buying opportunity.
- Stochastic Oscillator: Both %K and %D are in oversold territory, suggesting a possible reversal.
Volatility Analysis:
- Bollinger Bands (BB): The bands have been narrowing, indicating decreasing volatility.
- Bollinger %B (BBP): %B has been decreasing, showing a lack of volatility in recent days.
Volume Analysis:
- On-Balance Volume (OBV): OBV has been consistently negative, indicating distribution and selling pressure.
- Chaikin Money Flow (CMF): CMF has been negative, reflecting a lack of buying interest.
Key Observations:
- The stock is currently in a strong bearish trend based on moving averages and MACD.
- Momentum indicators suggest a potential reversal due to oversold conditions.
- Volatility has been decreasing, indicating a possible period of consolidation.
- Volume indicators show selling pressure and lack of buying interest.
Conclusion:
Based on the technical analysis of TIXT stock: - The stock is likely to experience further downside movement in the short term. - However, the oversold conditions in momentum indicators suggest a potential reversal or a temporary bounce. - The decreasing volatility and negative volume indicators support a sideways or consolidating phase in the near future. - Caution is advised for traders and investors, as the stock may exhibit choppy price action before establishing a clear direction.
Recommendation:
- Short-term traders: Consider waiting for a confirmation of a reversal signal before entering a long position.
- Long-term investors: Monitor the stock for signs of stabilization before considering adding to or initiating a position.
- Risk management: Set stop-loss orders to protect capital in case of further downside movement.
Disclaimer:
This analysis is based solely on technical indicators and historical price data. Market conditions can change rapidly, and unforeseen events may impact stock prices. It is essential to conduct thorough research and consider other factors before making investment decisions. Consulting with a financial advisor is recommended for personalized guidance tailored to individual risk tolerance and investment goals.