Technical Analysis of TJX 2024-05-10
Overview:
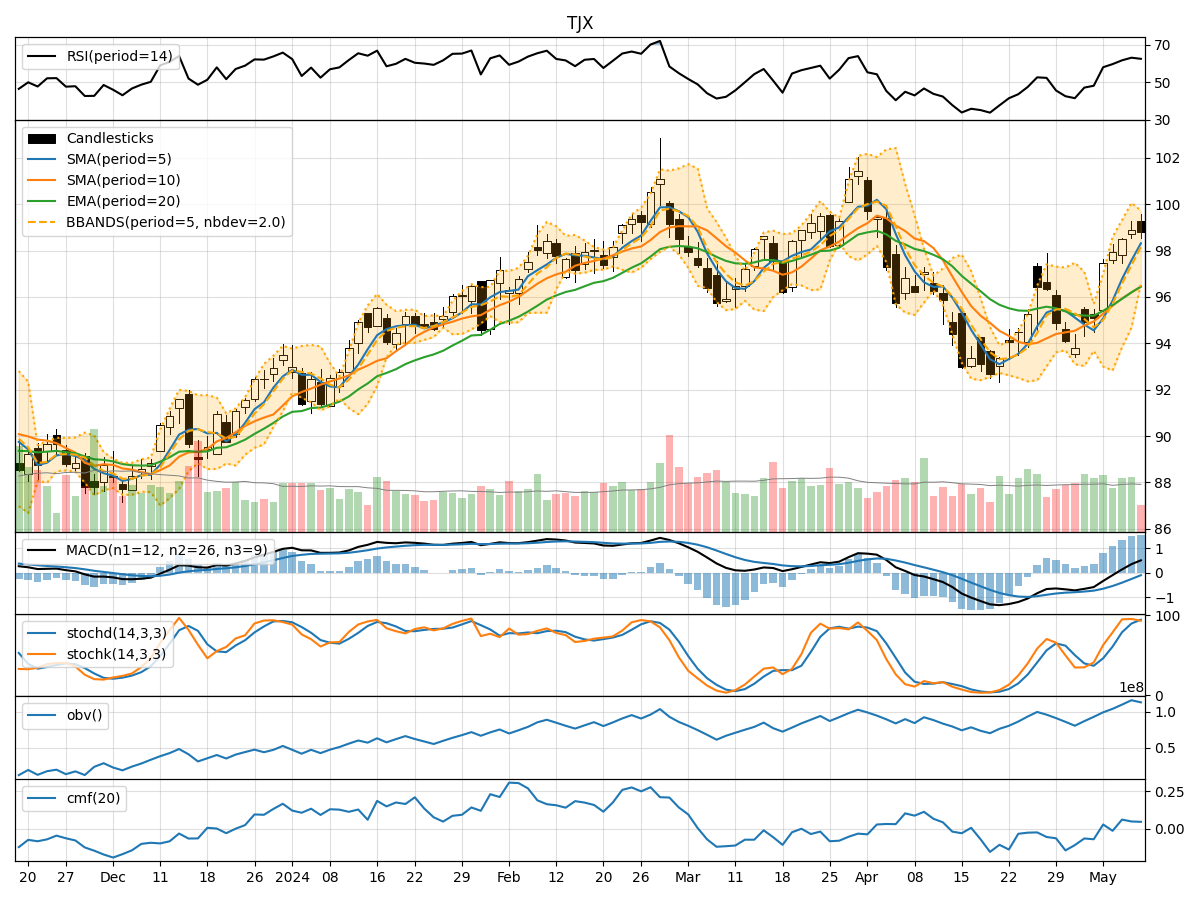
In analyzing the technical indicators for TJX over the last 5 days, we will delve into the trend, momentum, volatility, and volume indicators to provide a comprehensive outlook on the possible stock price movement. By examining these key factors, we aim to offer valuable insights and predictions for the upcoming days.
Trend Indicators:
- Moving Averages (MA): The 5-day moving average has been consistently rising, indicating a bullish trend in the short term.
- MACD: The MACD line has been positive and increasing, suggesting upward momentum.
- EMA: The exponential moving average has also been trending upwards, supporting the bullish sentiment.
Momentum Indicators:
- RSI: The Relative Strength Index has been in the neutral zone, indicating neither overbought nor oversold conditions.
- Stochastic Oscillator: Both %K and %D have been in the overbought territory, signaling potential for a pullback.
- Williams %R: The indicator has been in the oversold region, suggesting a possible reversal in the short term.
Volatility Indicators:
- Bollinger Bands: The bands have been widening, indicating increased volatility in the stock price.
- Bollinger %B: The %B indicator has been hovering around 0.7, suggesting the stock is trading closer to the upper band.
Volume Indicators:
- On-Balance Volume (OBV): The OBV has been increasing, reflecting positive volume flow into the stock.
- Chaikin Money Flow (CMF): The CMF has been positive, indicating buying pressure in the stock.
Key Observations:
- The trend indicators suggest a bullish sentiment in the short term, supported by moving averages and MACD.
- Momentum indicators show a mixed picture with RSI neutral, Stochastic overbought, and Williams %R oversold.
- Volatility has been increasing, indicating potential price swings.
- Volume indicators reflect positive volume flow and buying pressure in the stock.
Conclusion:
Based on the analysis of technical indicators, the next few days' possible stock price movement for TJX is likely to be bullish in the short term. The trend indicators support a positive outlook, while momentum indicators suggest a potential pullback before resuming the uptrend. Volatility may lead to price swings, but overall, the buying pressure indicated by volume indicators supports a bullish view. Traders and investors should consider entering long positions with caution, keeping an eye on potential pullback levels indicated by momentum indicators.