Technical Analysis of TKC 2024-05-10
Overview:
In analyzing the technical indicators for TKC over the last 5 days, we will delve into the trend, momentum, volatility, and volume indicators to provide a comprehensive outlook on the possible stock price movement in the coming days. By examining these key indicators, we aim to offer valuable insights and recommendations for potential investors.
Trend Indicators:
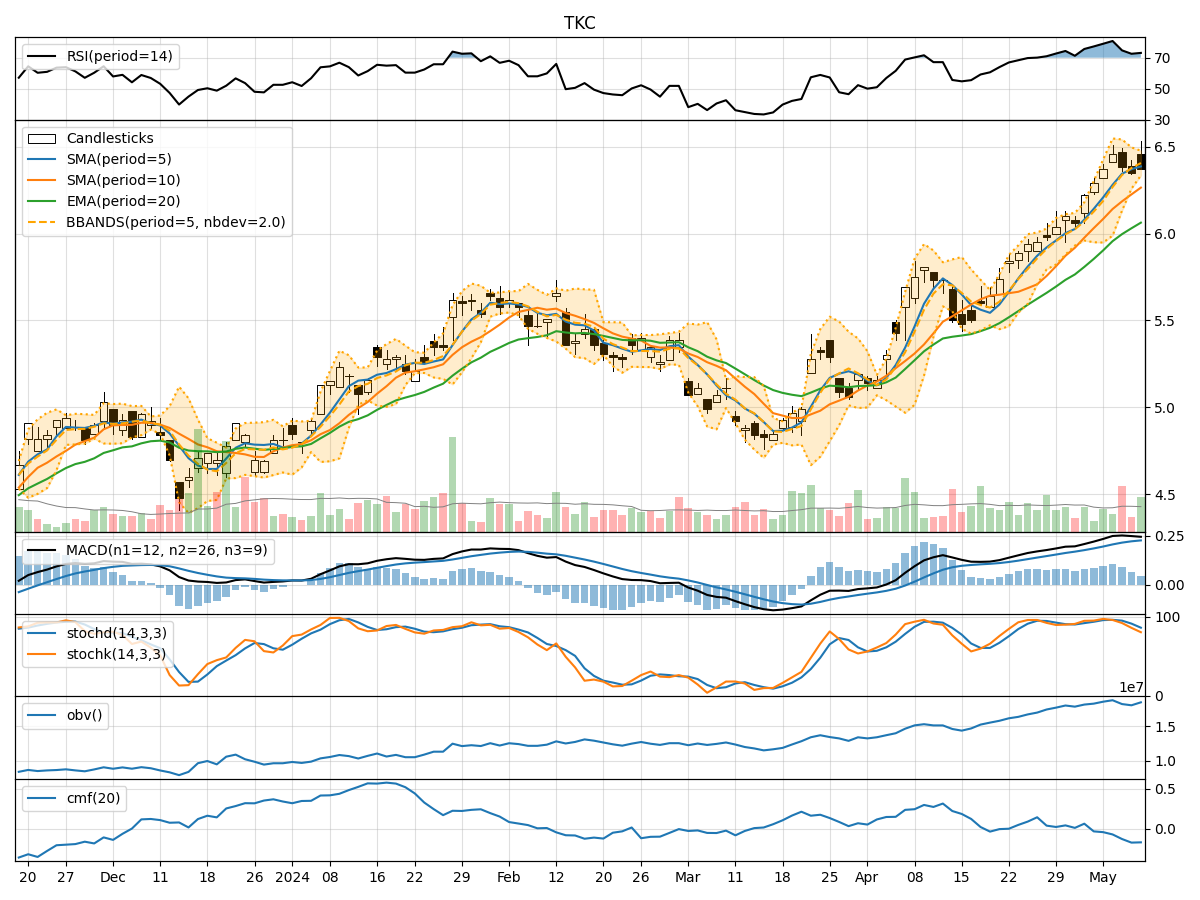
- Moving Averages (MA): The 5-day MA has been consistently above the closing prices, indicating a bullish trend.
- MACD: The MACD line has been above the signal line, suggesting a positive momentum in the stock price.
- EMA: The exponential moving average has been trending upwards, supporting the bullish sentiment.
Momentum Indicators:
- RSI: The RSI values have been relatively high, indicating overbought conditions in the stock.
- Stochastic Oscillator: Both %K and %D values have been decreasing, signaling a potential reversal in momentum.
- Williams %R: The stock has been in oversold territory, suggesting a possible upcoming correction.
Volatility Indicators:
- Bollinger Bands: The stock price has been trading within the bands, indicating a period of consolidation.
- Bollinger %B: The %B value has been fluctuating around 0.5, reflecting a balanced market sentiment.
Volume Indicators:
- On-Balance Volume (OBV): The OBV has been declining, indicating selling pressure in the stock.
- Chaikin Money Flow (CMF): The CMF has been negative, suggesting outflow of money from the stock.
Key Observations:
- The trend indicators suggest a bullish sentiment in the stock price.
- Momentum indicators show signs of potential reversal or correction in the near term.
- Volatility indicators point towards a period of consolidation.
- Volume indicators indicate selling pressure and negative money flow.
Conclusion:
Based on the analysis of the technical indicators, the stock price of TKC is likely to experience a short-term correction or consolidation in the coming days. The overbought conditions, decreasing momentum, and negative volume indicators suggest a possible downward movement. Investors should exercise caution and consider waiting for a clearer trend before making any significant trading decisions.