Technical Analysis of TKO 2024-05-10
Overview:
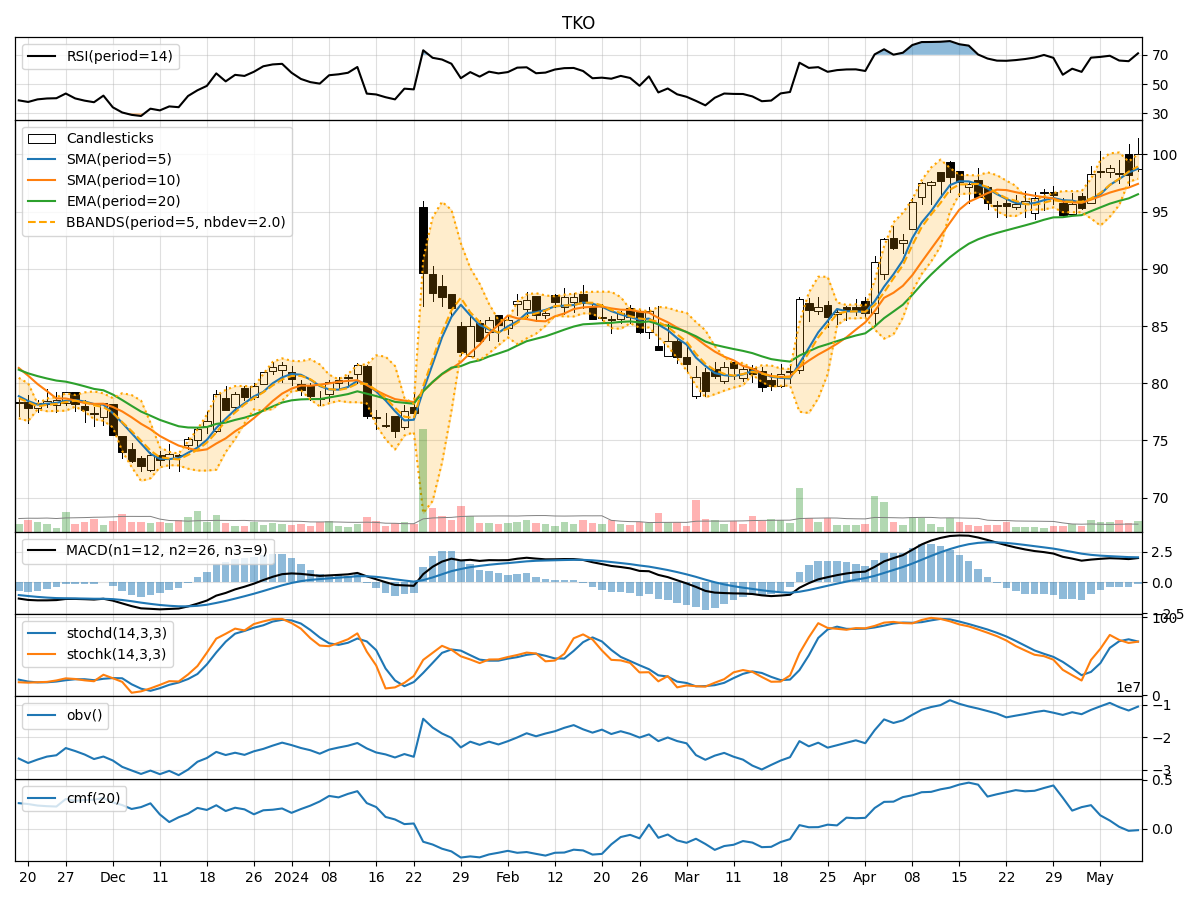
In analyzing the technical indicators for TKO stock over the last 5 days, we will delve into the trends, momentum, volatility, and volume aspects to provide a comprehensive outlook on the possible stock price movement in the coming days. By examining key indicators such as moving averages, MACD, RSI, Bollinger Bands, and OBV, we aim to offer valuable insights and predictions for informed decision-making.
Trend Analysis:
- Moving Averages (MA): The 5-day moving average has been consistently above the longer-term SMAs, indicating a short-term uptrend in the stock price.
- MACD: The MACD line has been above the signal line for the past 5 days, suggesting bullish momentum in the stock.
Key Observation: The stock is currently in an upward trend based on moving averages and MACD.
Momentum Analysis:
- RSI: The RSI values have been fluctuating but generally staying within the neutral to slightly overbought territory, indicating moderate buying pressure.
- Stochastic Oscillator: Both %K and %D have been moving within a range, not showing any extreme overbought or oversold conditions.
Key Observation: Momentum indicators suggest a neutral to slightly bullish sentiment in the stock.
Volatility Analysis:
- Bollinger Bands (BB): The stock price has been trading within the bands, with no significant breaches, indicating stable price volatility.
Key Observation: Volatility is stable with no extreme price movements.
Volume Analysis:
- On-Balance Volume (OBV): The OBV has shown mixed movements over the past 5 days, indicating indecision among investors.
Key Observation: Volume indicators suggest mixed sentiment in the stock.
Conclusion:
Based on the analysis of trend, momentum, volatility, and volume indicators, the overall outlook for TKO stock in the next few days is neutral with a slight bullish bias. The stock is currently in an upward trend supported by moving averages and MACD, while momentum indicators show moderate buying pressure. Volatility remains stable, and volume indicators reflect mixed investor sentiment.
Recommendation:
Considering the overall analysis, it is advisable to monitor the stock closely for any potential breakout or reversal signals. Traders may consider buying on dips within the context of the current uptrend, while investors might opt to hold positions with a cautious approach until clearer signals emerge.
Disclaimer:
Remember that market conditions can change rapidly, and it is essential to conduct ongoing analysis and risk management. This analysis is based on historical data and technical indicators, and actual market outcomes may vary. Always consider multiple factors and consult with a financial advisor before making investment decisions.