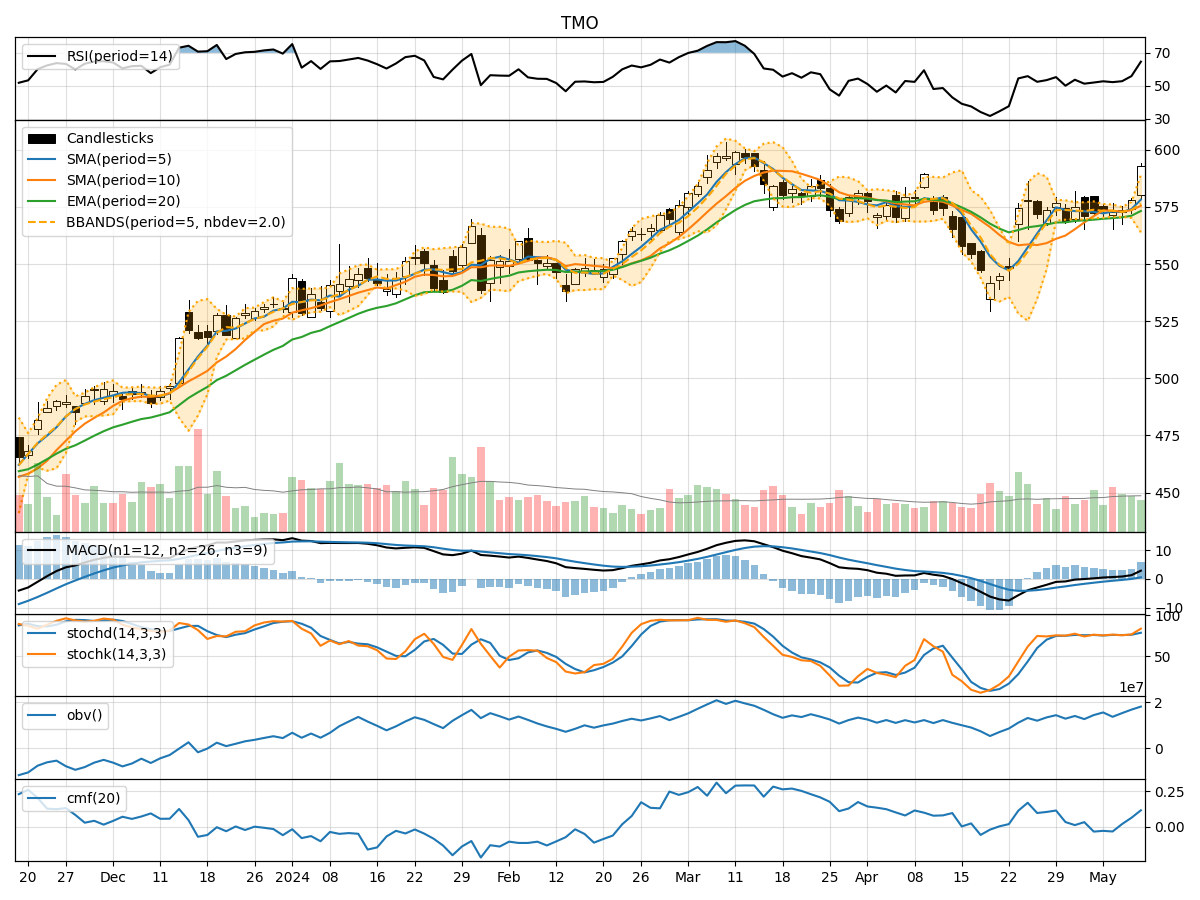
Technical Analysis of TMO 2024-05-10
Overview:
In analyzing the technical indicators for TMO over the last 5 days, we will delve into the trend, momentum, volatility, and volume indicators to provide a comprehensive outlook on the possible stock price movement in the coming days.
Trend Analysis:
- Moving Averages (MA): The 5-day Moving Average (MA) has been showing an upward trend, indicating a positive momentum in the stock price.
- MACD: The Moving Average Convergence Divergence (MACD) has been consistently increasing, with the MACD line crossing above the signal line, suggesting a bullish trend.
- EMA: The Exponential Moving Average (EMA) has been on an upward trajectory, further supporting the bullish sentiment.
Momentum Analysis:
- RSI: The Relative Strength Index (RSI) has been gradually increasing, reaching a level of 64.75 on the last trading day, indicating a strengthening momentum.
- Stochastic Oscillator: Both %K and %D lines of the Stochastic Oscillator are in the overbought territory, signaling a potential reversal or consolidation in the near future.
- Williams %R: The Williams %R is close to the oversold region, suggesting a possible buying opportunity.
Volatility Analysis:
- Bollinger Bands: The Bollinger Bands have widened significantly on the last trading day, indicating increased volatility in the stock price.
- Bollinger %B: The %B indicator is close to 1, suggesting that the stock price is trading near the upper band, potentially indicating an overbought condition.
Volume Analysis:
- On-Balance Volume (OBV): The OBV indicator has been steadily increasing over the last 5 days, reflecting strong buying pressure in the stock.
- Chaikin Money Flow (CMF): The CMF has been positive, indicating that money is flowing into the stock, supporting the bullish outlook.
Conclusion:
Based on the analysis of the technical indicators, the overall outlook for TMO in the next few days is bullish. The trend indicators, including moving averages and MACD, suggest a continued upward momentum in the stock price. The momentum indicators, such as RSI and Stochastic Oscillator, also support the bullish view, although caution is advised as the stock may be nearing overbought levels. The volatility analysis indicates increased price fluctuations, which could present trading opportunities for short-term traders. The volume indicators signal strong buying interest in the stock, further reinforcing the bullish sentiment.
In conclusion, considering the collective strength of the technical indicators and the prevailing market dynamics, it is likely that TMO will experience further upward movement in the coming days. Investors may consider capitalizing on potential buying opportunities while monitoring the overbought conditions indicated by the Stochastic Oscillator.