Technical Analysis of TNL 2024-05-10
Overview:
In analyzing the technical indicators for TNL over the last 5 days, we will delve into the trend, momentum, volatility, and volume indicators to provide a comprehensive outlook on the possible stock price movement in the coming days. By examining these key aspects, we aim to offer valuable insights and predictions for informed decision-making.
Trend Analysis:
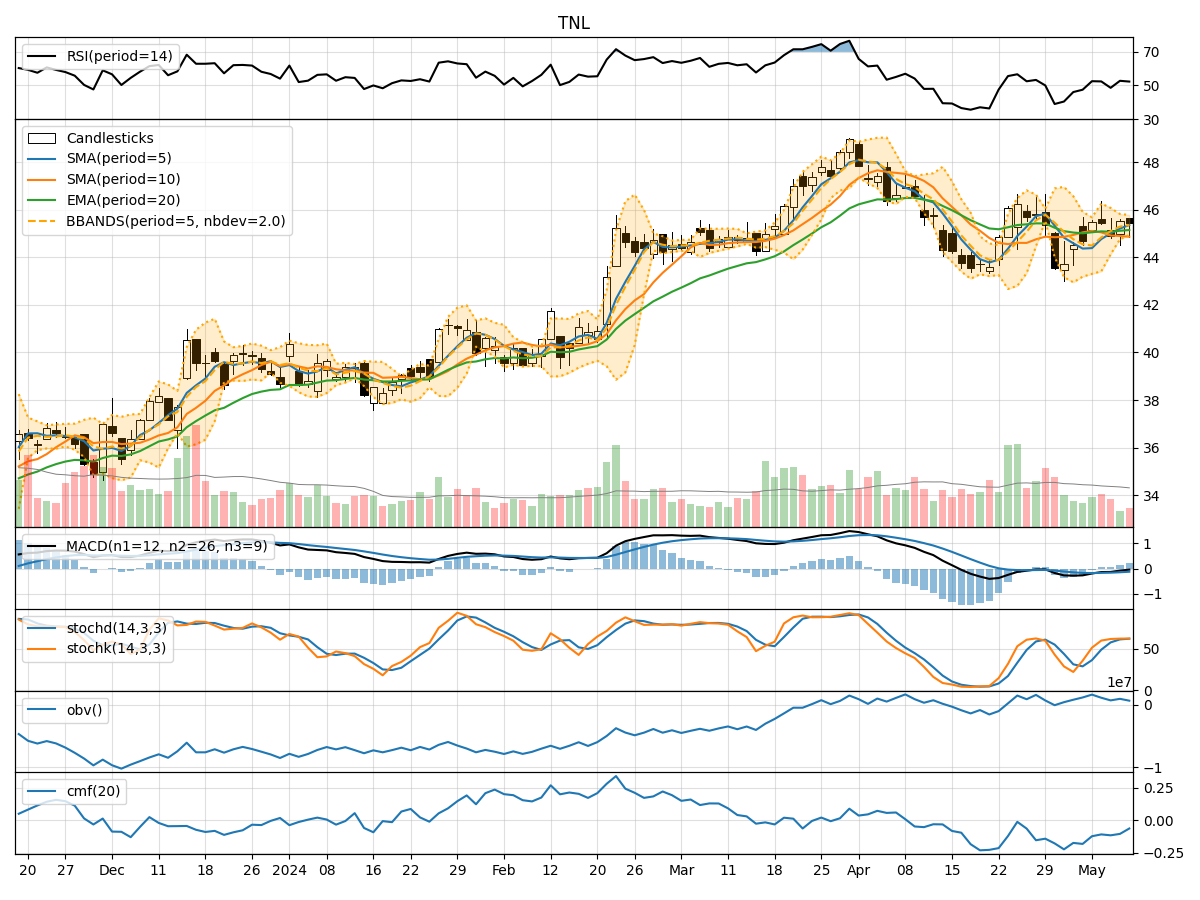
- Moving Averages (MA): The 5-day Moving Average (MA) has been consistently above the closing prices, indicating a potential bullish trend.
- MACD: The Moving Average Convergence Divergence (MACD) has shown positive values, suggesting a bullish momentum in the stock.
- EMA: The Exponential Moving Average (EMA) has been trending slightly upwards, supporting the bullish sentiment.
Momentum Analysis:
- RSI: The Relative Strength Index (RSI) has been hovering around the neutral zone, indicating a balanced momentum in the stock.
- Stochastic Oscillator: Both %K and %D values have been relatively high, suggesting a bullish momentum.
- Williams %R: The Williams %R indicator is in the oversold territory, signaling a potential buying opportunity.
Volatility Analysis:
- Bollinger Bands (BB): The Bollinger Bands have shown narrowing bands, indicating decreasing volatility in the stock.
- BB% (Bollinger Band %B): The %B value has been increasing, suggesting a potential bullish breakout.
- Average True Range (ATR): The ATR values have been relatively stable, indicating consistent price movements.
Volume Analysis:
- On-Balance Volume (OBV): The OBV indicator has shown a slight decrease, indicating a potential distribution phase.
- Chaikin Money Flow (CMF): The CMF has been negative, suggesting selling pressure in the stock.
Key Observations:
- The trend indicators point towards a bullish sentiment, supported by positive MACD and EMA trends.
- Momentum indicators show a mixed outlook with RSI in a neutral zone and Stochastic Oscillator indicating bullish momentum.
- Volatility has been decreasing, as indicated by the narrowing Bollinger Bands, potentially leading to a breakout.
- Volume indicators suggest a slight distribution phase with negative CMF values.
Conclusion:
Based on the analysis of the technical indicators, the stock price of TNL is likely to experience a short-term bullish movement in the coming days. The trend indicators support a positive outlook, while momentum indicators show a mixed sentiment. The decreasing volatility may lead to a breakout, and the volume indicators hint at a distribution phase. Overall, considering the bullish trend and momentum, investors may consider buying opportunities in TNL for potential short-term gains.