Technical Analysis of TOL 2024-05-10
Overview:
In analyzing the technical indicators for TOL over the last 5 days, we will delve into the trend, momentum, volatility, and volume indicators to provide a comprehensive outlook on the possible stock price movement in the coming days. By examining these key aspects, we aim to offer valuable insights and predictions for informed decision-making.
Trend Analysis:
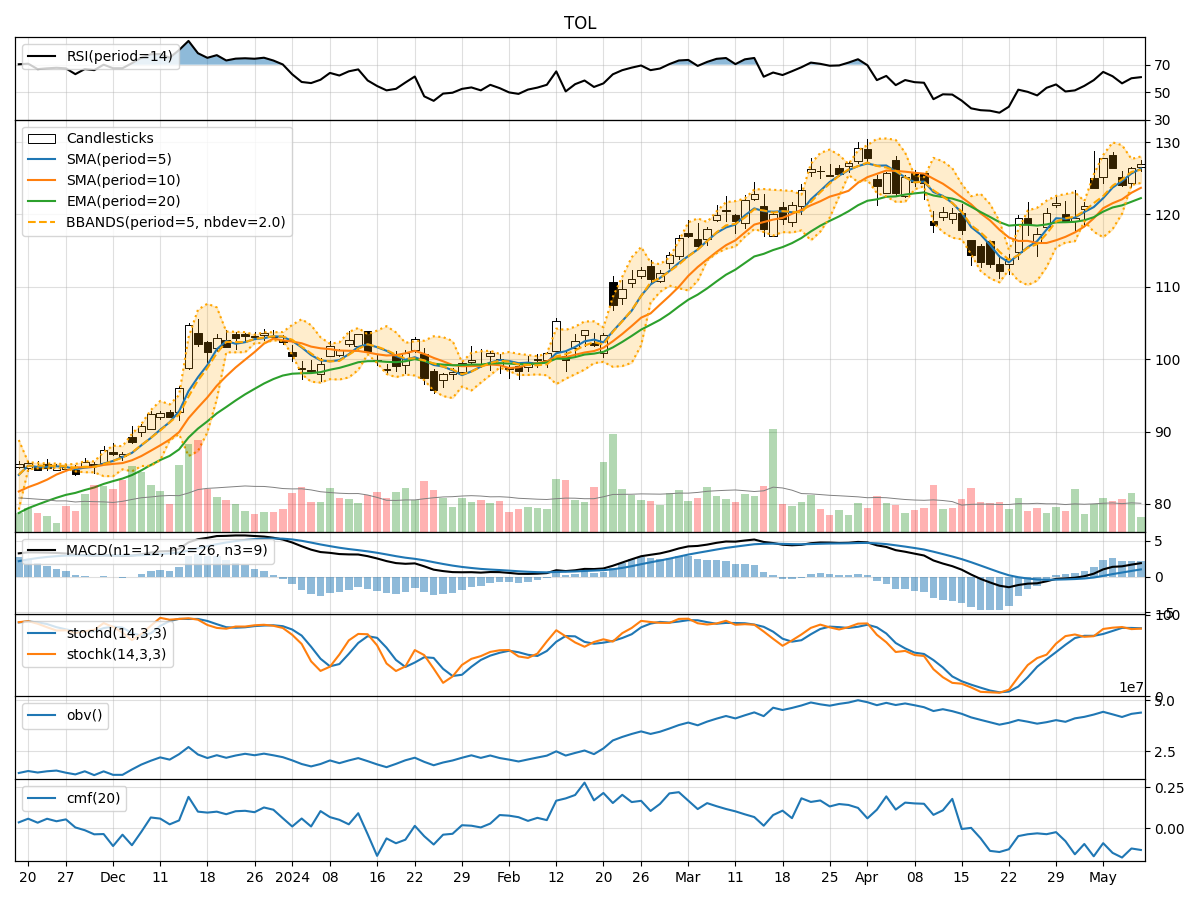
- Moving Averages (MA): The 5-day Moving Average (MA) has been consistently rising, indicating a bullish trend in the short term.
- MACD: The MACD line has been above the signal line for the past 5 days, suggesting a bullish momentum.
- RSI: The Relative Strength Index (RSI) has shown fluctuations but generally remains in the neutral zone, indicating a balanced market sentiment.
Momentum Analysis:
- Stochastic Oscillator: The Stochastic Oscillator has been fluctuating but remains in the overbought territory, signaling a potential reversal.
- Williams %R: The Williams %R indicator has been hovering around oversold levels, suggesting a possible buying opportunity.
Volatility Analysis:
- Bollinger Bands: The Bollinger Bands have been narrowing, indicating decreasing volatility and a potential breakout in price.
- Volatility Indicators: The volatility indicators show a decreasing trend, suggesting a stabilization in price movements.
Volume Analysis:
- On-Balance Volume (OBV): The OBV has shown mixed signals, reflecting indecision among market participants.
- Chaikin Money Flow (CMF): The CMF remains negative, indicating selling pressure in the market.
Conclusion:
Based on the analysis of the technical indicators, the stock of TOL is likely to experience sideways consolidation in the coming days. The bullish trend indicated by moving averages and MACD may be offset by the overbought levels in the Stochastic Oscillator and the negative CMF. The narrowing Bollinger Bands suggest a potential breakout, but the overall lack of strong momentum indicators points towards a period of consolidation.
Recommendation:
- Short-term Traders: Consider taking profits or reducing positions during price spikes within the consolidation range.
- Long-term Investors: Monitor the price action for a clear breakout above resistance or breakdown below support before making significant investment decisions.
In conclusion, while the technical indicators suggest a period of consolidation for TOL, it is essential to monitor the price action closely for any signs of a definitive trend reversal.