Technical Analysis of TPL 2024-05-10
Overview:
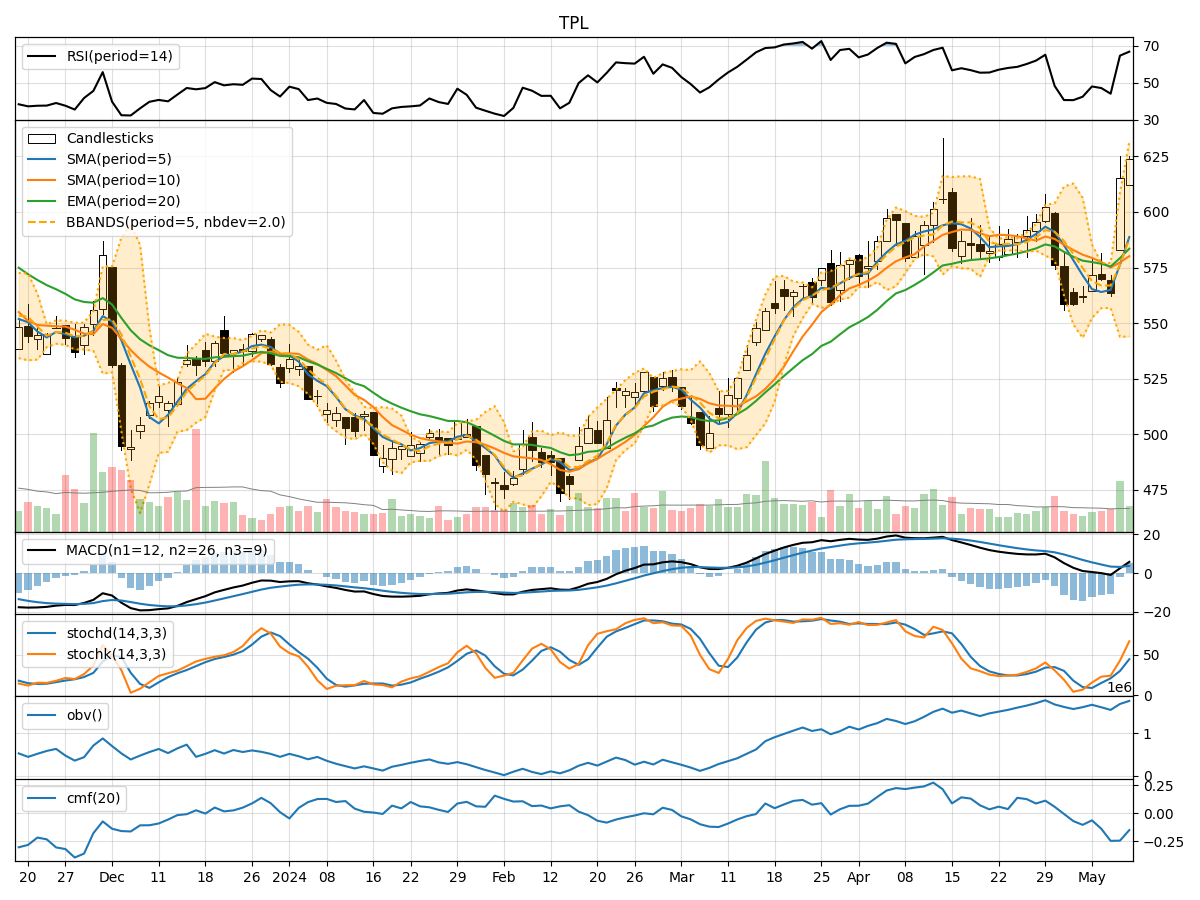
In analyzing the technical indicators for TPL over the last 5 days, we will delve into the trend, momentum, volatility, and volume indicators to provide insights into the possible future stock price movements. By examining these key aspects, we aim to offer a comprehensive and informed perspective on the potential direction of TPL's stock price in the coming days.
Trend Analysis:
- Moving Averages (MA): The 5-day Moving Average (MA) has been showing an upward trend, indicating a positive momentum in the stock price.
- MACD: The Moving Average Convergence Divergence (MACD) has been consistently increasing, suggesting a strengthening bullish momentum.
- EMA: The Exponential Moving Average (EMA) has also been on an upward trajectory, supporting the bullish sentiment in the short to medium term.
Momentum Analysis:
- RSI: The Relative Strength Index (RSI) has been increasing, reflecting a growing buying pressure in the stock.
- Stochastic Oscillator: Both %K and %D of the Stochastic Oscillator have been rising, indicating an uptrend in momentum.
- Williams %R: The Williams %R is moving towards the oversold region, suggesting a potential buying opportunity.
Volatility Analysis:
- Bollinger Bands (BB): The Bollinger Bands have been widening, indicating increased volatility in the stock price.
- BB %B: The %B indicator is relatively low, suggesting a possible oversold condition in the stock.
- BB Width: The widening of the Bollinger Bands width signifies heightened price fluctuations.
Volume Analysis:
- On-Balance Volume (OBV): The OBV indicator has been fluctuating, reflecting mixed buying and selling pressure in the stock.
- Chaikin Money Flow (CMF): The CMF has been negative, indicating a net outflow of money from the stock.
Key Observations:
- The trend indicators suggest a bullish sentiment with positive moving averages and MACD.
- Momentum indicators show a strengthening buying pressure with rising RSI and Stochastic Oscillator.
- Volatility indicators point towards increased price fluctuations and potential buying opportunities.
- Volume indicators reflect mixed sentiments with fluctuating OBV and negative CMF.
Conclusion:
Based on the analysis of the technical indicators, the next few days for TPL stock price are likely to see an upward movement. The bullish trend, positive momentum, increased volatility offering trading opportunities, and mixed volume signals indicate a potential for the stock price to continue its upward trajectory. Traders and investors may consider taking long positions or capitalizing on short-term price fluctuations in line with the bullish outlook.