Technical Analysis of TREX 2024-05-10
Overview:
In analyzing the technical indicators for TREX over the last 5 days, we will delve into the trend, momentum, volatility, and volume indicators to provide a comprehensive outlook on the possible stock price movement in the coming days. By examining these key indicators, we aim to offer valuable insights and predictions for informed decision-making.
Trend Analysis:
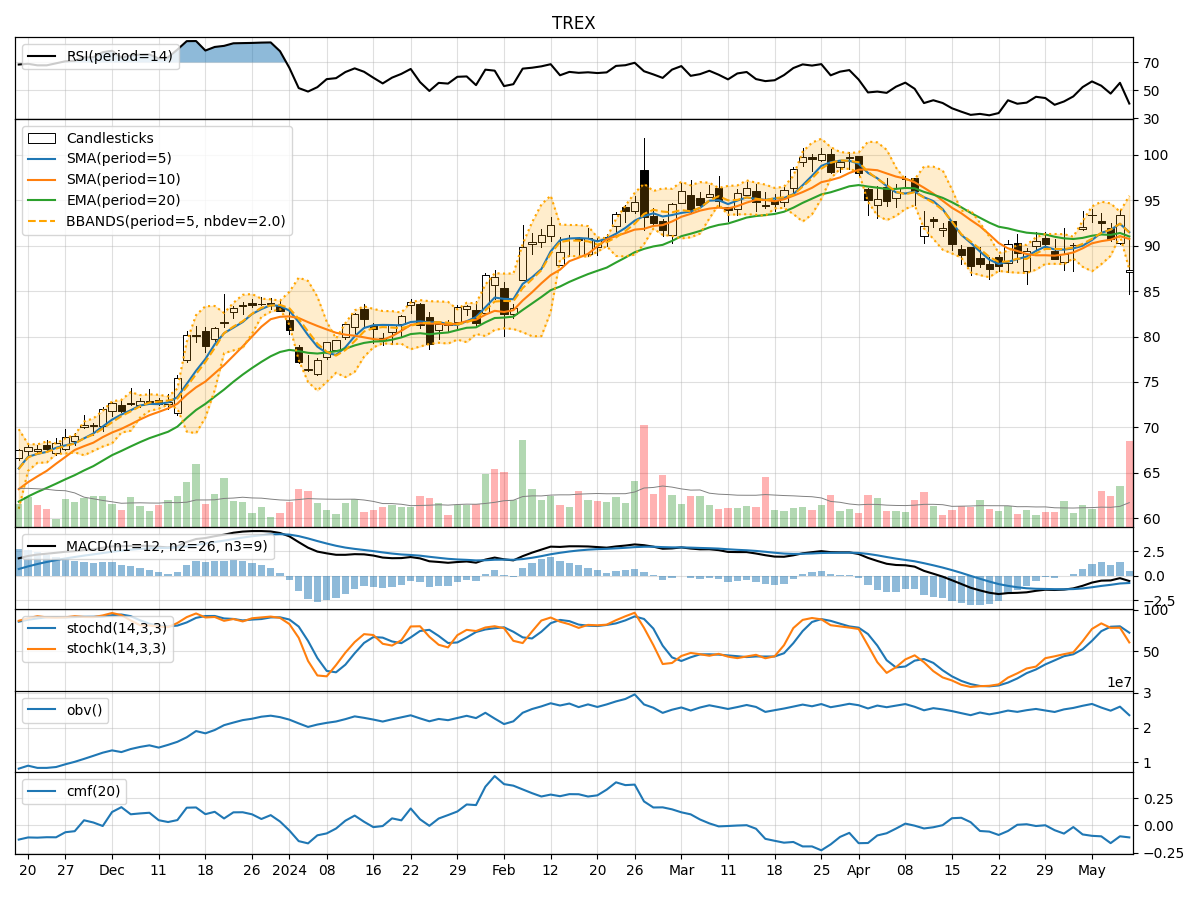
- Moving Averages (MA): The 5-day Moving Average (MA) has been fluctuating around the Simple Moving Average (SMA) and Exponential Moving Average (EMA) values, indicating a lack of clear trend direction.
- MACD: The Moving Average Convergence Divergence (MACD) has shown negative values, suggesting a bearish momentum in the short term.
- Conclusion: The trend indicators point towards a bearish sentiment in the short term.
Momentum Analysis:
- RSI: The Relative Strength Index (RSI) has been oscillating around the mid-level, indicating a neutral momentum.
- Stochastic Oscillator: Both %K and %D values have been fluctuating, reflecting indecision in momentum.
- Conclusion: The momentum indicators suggest a sideways movement with no clear direction.
Volatility Analysis:
- Bollinger Bands (BB): The Bollinger Bands have shown narrowing bands, indicating decreasing volatility.
- Conclusion: Volatility indicators signal a decreasing volatility trend.
Volume Analysis:
- On-Balance Volume (OBV): The OBV has been fluctuating, suggesting mixed buying and selling pressure.
- Chaikin Money Flow (CMF): The CMF has been negative, indicating a lack of strong buying interest.
- Conclusion: Volume indicators imply a neutral volume sentiment.
Key Observations and Opinions:
- The trend indicators suggest a bearish outlook in the short term.
- Momentum indicators indicate a sideways momentum with no clear direction.
- Volatility indicators point towards decreasing volatility.
- Volume indicators reflect a neutral volume sentiment with mixed buying and selling pressure.
Conclusion:
Based on the analysis of trend, momentum, volatility, and volume indicators, the next few days for TREX stock price movement are likely to be bearish in the short term, with a sideways momentum and decreasing volatility. Traders and investors should exercise caution and consider risk management strategies in light of the current market dynamics.