Technical Analysis of TRGP 2024-05-10
Overview:
In analyzing the technical indicators for TRGP over the last 5 days, we will delve into the trend, momentum, volatility, and volume indicators to provide a comprehensive outlook on the possible stock price movement in the coming days.
Trend Indicators:
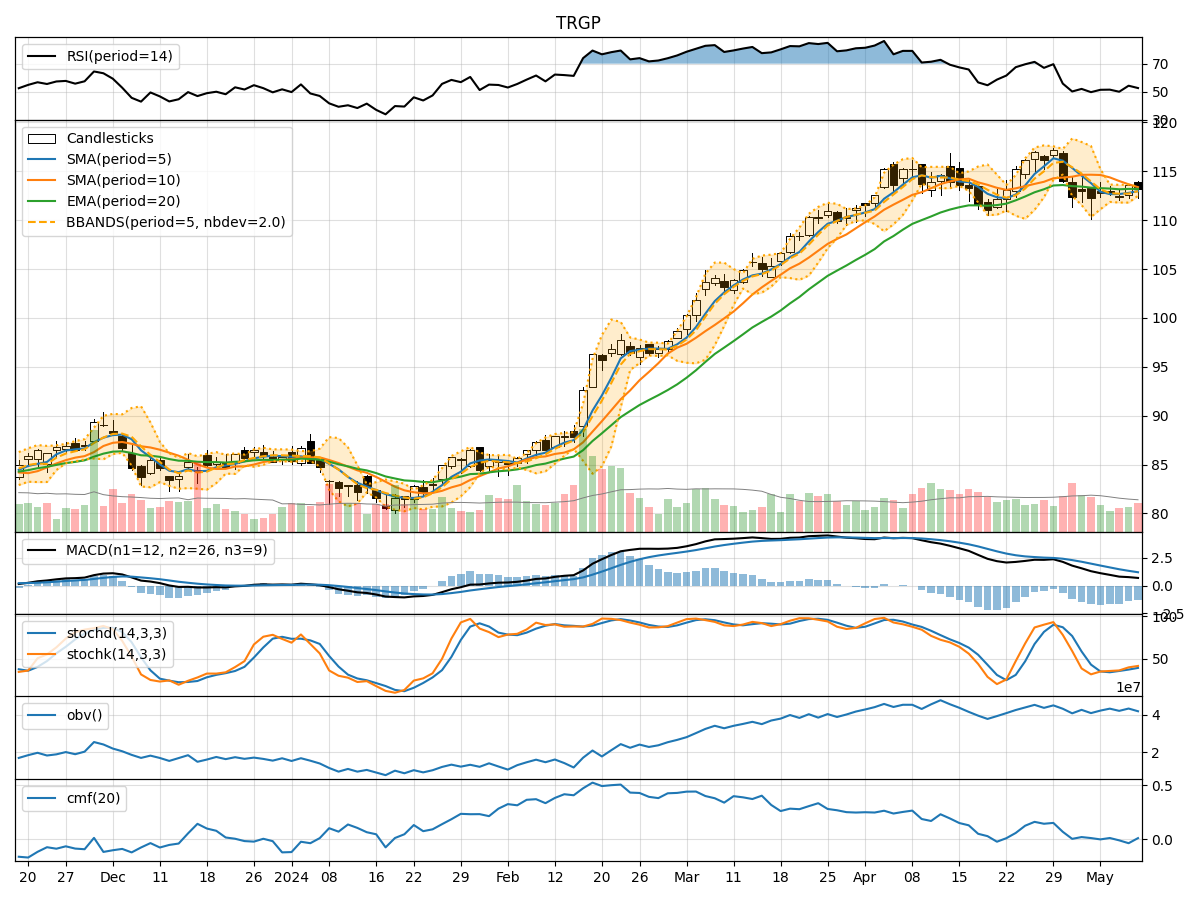
- Moving Averages (MA): The 5-day MA has been gradually decreasing, indicating a short-term downtrend. The stock price is below both the 10-day SMA and the 20-day EMA, suggesting a bearish sentiment.
- Moving Average Convergence Divergence (MACD): The MACD line is below the signal line, indicating a bearish signal. The MACD histogram is also in negative territory, further supporting a bearish outlook.
Momentum Indicators:
- Relative Strength Index (RSI): The RSI is hovering around the neutral zone, indicating a lack of strong momentum in either direction.
- Stochastic Oscillator: Both %K and %D lines of the Stochastic Oscillator are below 50, suggesting a bearish momentum.
- Williams %R (Willams %R): The Williams %R is in oversold territory, indicating a potential reversal or consolidation.
Volatility Indicators:
- Bollinger Bands (BB): The stock price has been trading within the Bollinger Bands, with the bands narrowing, indicating decreasing volatility.
- Bollinger Band Percentage (BBP): The BBP is relatively low, suggesting a potential breakout or reversal in the near future.
Volume Indicators:
- On-Balance Volume (OBV): The OBV has been fluctuating, indicating indecision among investors regarding the stock.
- Chaikin Money Flow (CMF): The CMF is slightly negative, suggesting some selling pressure in the stock.
Key Observations and Opinions:
- Trend: The trend indicators point towards a bearish sentiment with the stock trading below key moving averages and showing a negative MACD signal.
- Momentum: Momentum indicators suggest a lack of strong momentum, with a slight bearish bias indicated by the Stochastic Oscillator.
- Volatility: Volatility has been decreasing, potentially signaling a period of consolidation or a calm before a potential price movement.
- Volume: Volume indicators show mixed signals, with OBV fluctuating and CMF slightly negative, indicating uncertainty among market participants.
Conclusion:
Based on the analysis of the technical indicators, the next few days' possible stock price movement for TRGP is likely to be sideways with a slight bearish bias. Investors should closely monitor key support and resistance levels, as a breakout in either direction could signal a new trend. It is advisable to wait for confirmation from multiple indicators before making any significant trading decisions.