Technical Analysis of TS 2024-05-10
Overview:
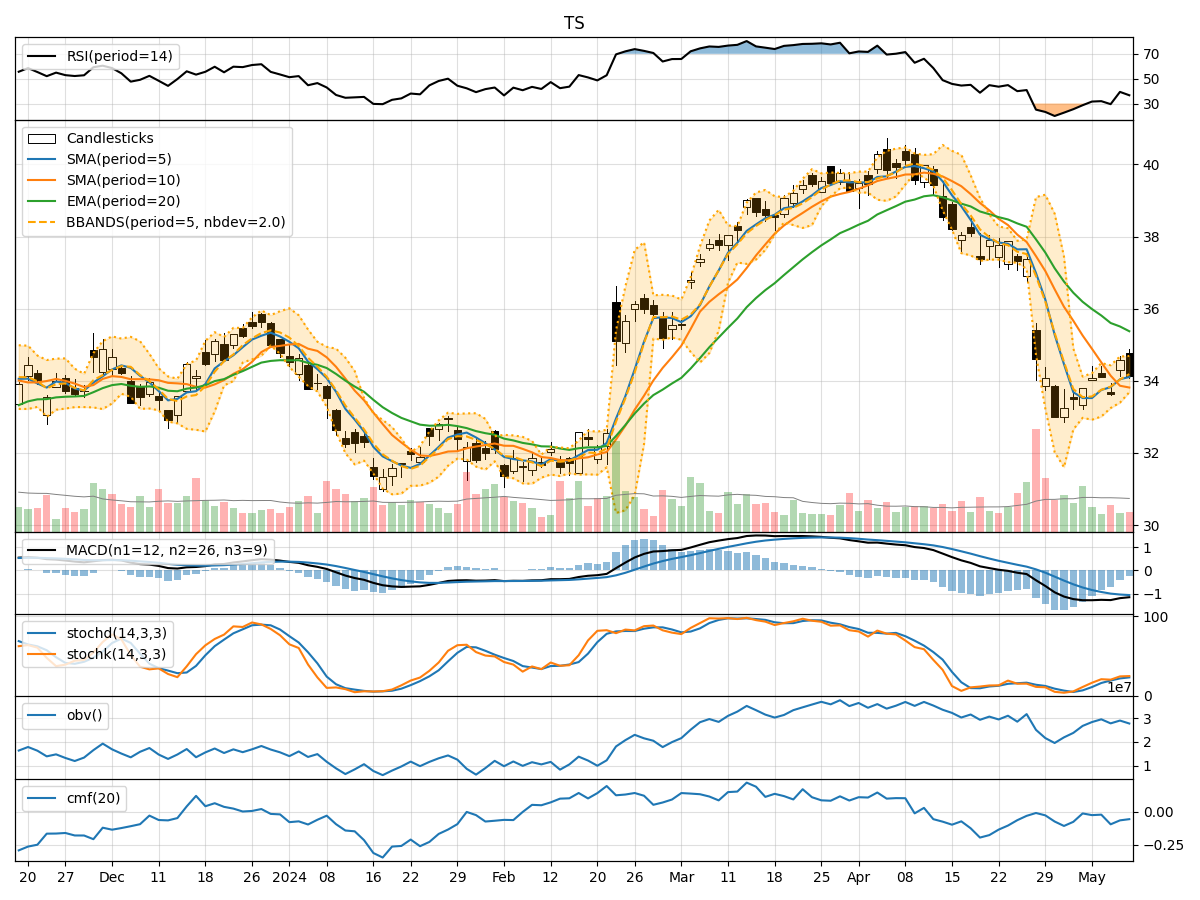
In the last 5 trading days, the stock price has shown some fluctuations with a mix of bullish and bearish signals across various technical indicators. We will analyze the trend, momentum, volatility, and volume indicators to provide insights into the possible future stock price movement.
Trend Indicators:
- Moving Averages (MA): The 5-day Moving Average (MA) has been fluctuating around the closing prices, indicating short-term price trends. The Simple Moving Average (SMA) and Exponential Moving Average (EMA) show a downward trend, suggesting a bearish sentiment in the short to mid-term.
- Moving Average Convergence Divergence (MACD): The MACD line has been consistently below the signal line, indicating a bearish trend in momentum.
- Conclusion: The trend indicators suggest a bearish outlook for the stock in the short to mid-term.
Momentum Indicators:
- Relative Strength Index (RSI): The RSI values have been fluctuating but are not in overbought or oversold territory, indicating a neutral momentum.
- Stochastic Oscillator: Both %K and %D values are relatively low, suggesting a lack of strong momentum.
- Conclusion: The momentum indicators show a neutral stance with no clear direction.
Volatility Indicators:
- Bollinger Bands (BB): The stock price has been trading within the Bollinger Bands, indicating normal volatility levels.
- Conclusion: Volatility indicators suggest stable price movements with no extreme fluctuations expected.
Volume Indicators:
- On-Balance Volume (OBV): The OBV values have been fluctuating, indicating mixed buying and selling pressure.
- Chaikin Money Flow (CMF): The CMF values are negative, suggesting a slight distribution phase.
- Conclusion: Volume indicators reflect mixed sentiment with no clear dominance of buying or selling pressure.
Overall Conclusion:
Based on the analysis of trend, momentum, volatility, and volume indicators, the stock is likely to experience sideways consolidation in the next few days. The bearish trend indicated by moving averages and MACD, coupled with neutral momentum and mixed volume signals, suggest a lack of clear direction in the near term. Traders may expect the stock price to trade within a range with no significant upward or downward movements expected.
Recommendation:
- Short-term Traders: Consider staying on the sidelines or implementing range-bound strategies due to the lack of a clear trend.
- Long-term Investors: Monitor the stock closely for a potential breakout or trend reversal before making any significant investment decisions.
Disclaimer:
Remember that technical analysis is not a guaranteed predictor of future price movements, and other fundamental factors can influence stock prices. It is essential to conduct thorough research and consider multiple indicators before making any trading or investment decisions. Consulting with a financial advisor can provide personalized insights based on your risk tolerance and investment goals.