Technical Analysis of TUYA 2024-05-10
Overview:
In analyzing the technical indicators for TUYA over the last 5 days, we will delve into the trend, momentum, volatility, and volume indicators to provide a comprehensive outlook on the possible stock price movement. By examining these key aspects, we aim to offer valuable insights and predictions for the upcoming days.
Trend Analysis:
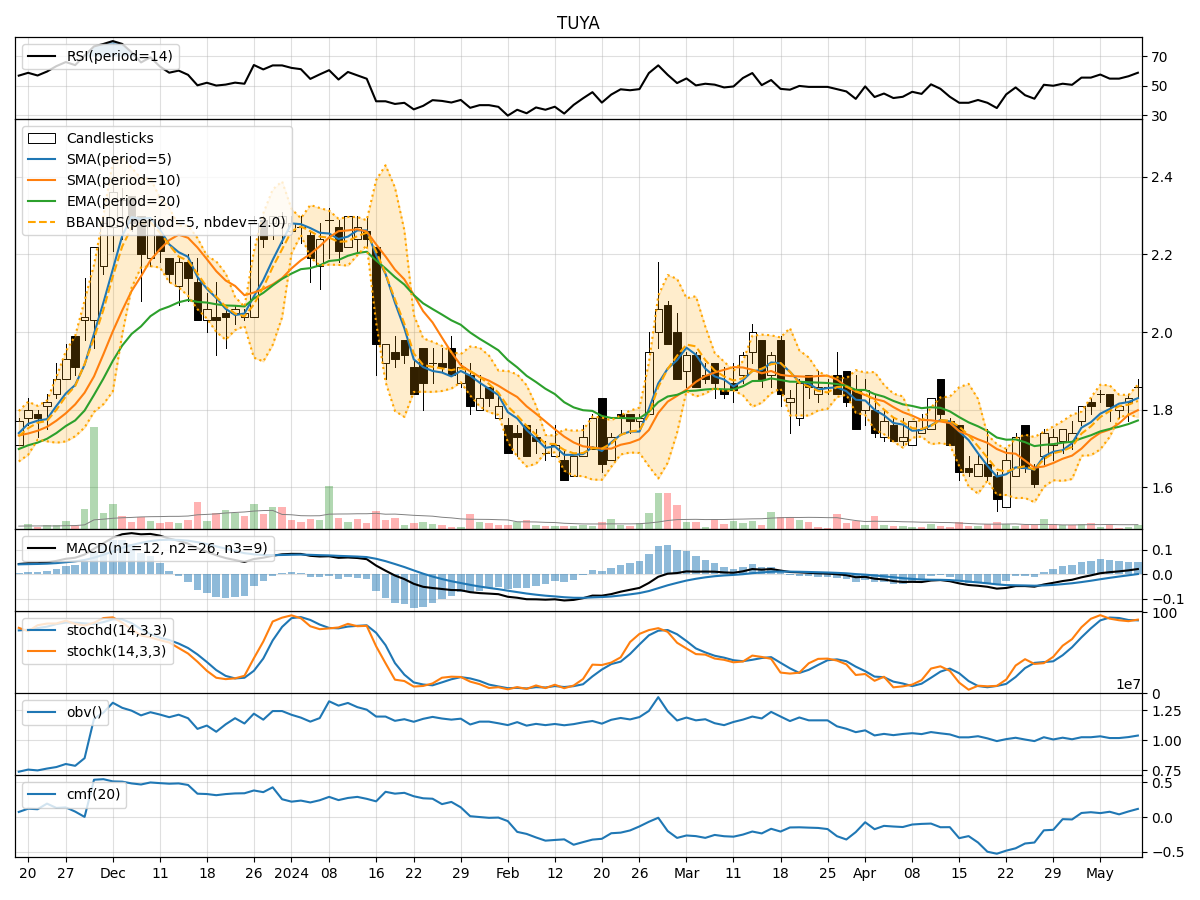
- Moving Averages (MA): The 5-day Moving Average (MA) has been showing an upward trend, indicating a positive momentum in the stock price.
- MACD: The Moving Average Convergence Divergence (MACD) has been consistently increasing, suggesting a strengthening bullish trend.
- RSI: The Relative Strength Index (RSI) has been fluctuating but generally staying within the neutral range, indicating a balanced market sentiment.
Momentum Analysis:
- Stochastic Oscillator: Both %K and %D values have been fluctuating but staying above the oversold threshold, suggesting a potential continuation of the upward momentum.
- Williams %R: The Williams %R indicator has been hovering around oversold levels, indicating a possible buying opportunity.
Volatility Analysis:
- Bollinger Bands: The Bollinger Bands have been widening, indicating increased volatility in the stock price.
- Average True Range (ATR): The ATR value has been relatively stable, suggesting consistent price movements without extreme fluctuations.
Volume Analysis:
- On-Balance Volume (OBV): The OBV has been showing a mixed trend, indicating some distribution of shares alongside accumulation.
- Chaikin Money Flow (CMF): The CMF has been gradually increasing, signaling a potential influx of money into the stock.
Key Observations:
- The trend indicators suggest a bullish sentiment with positive moving averages and MACD values.
- Momentum indicators indicate a potential continuation of the upward momentum, supported by Stochastic and Williams %R.
- Volatility remains relatively stable with some fluctuations, as indicated by Bollinger Bands and ATR.
- Volume indicators show a mixed trend with both accumulation and distribution of shares.
Conclusion:
Based on the analysis of the technical indicators, the next few days for TUYA stock price movement are likely to be upward. The bullish trend supported by moving averages, MACD, and momentum indicators suggests a positive outlook. However, investors should remain cautious of potential volatility indicated by Bollinger Bands and monitor volume trends for confirmation of the upward movement. Overall, the technical analysis points towards a bullish view for TUYA in the upcoming days.