Technical Analysis of TYL 2024-05-10
Overview:
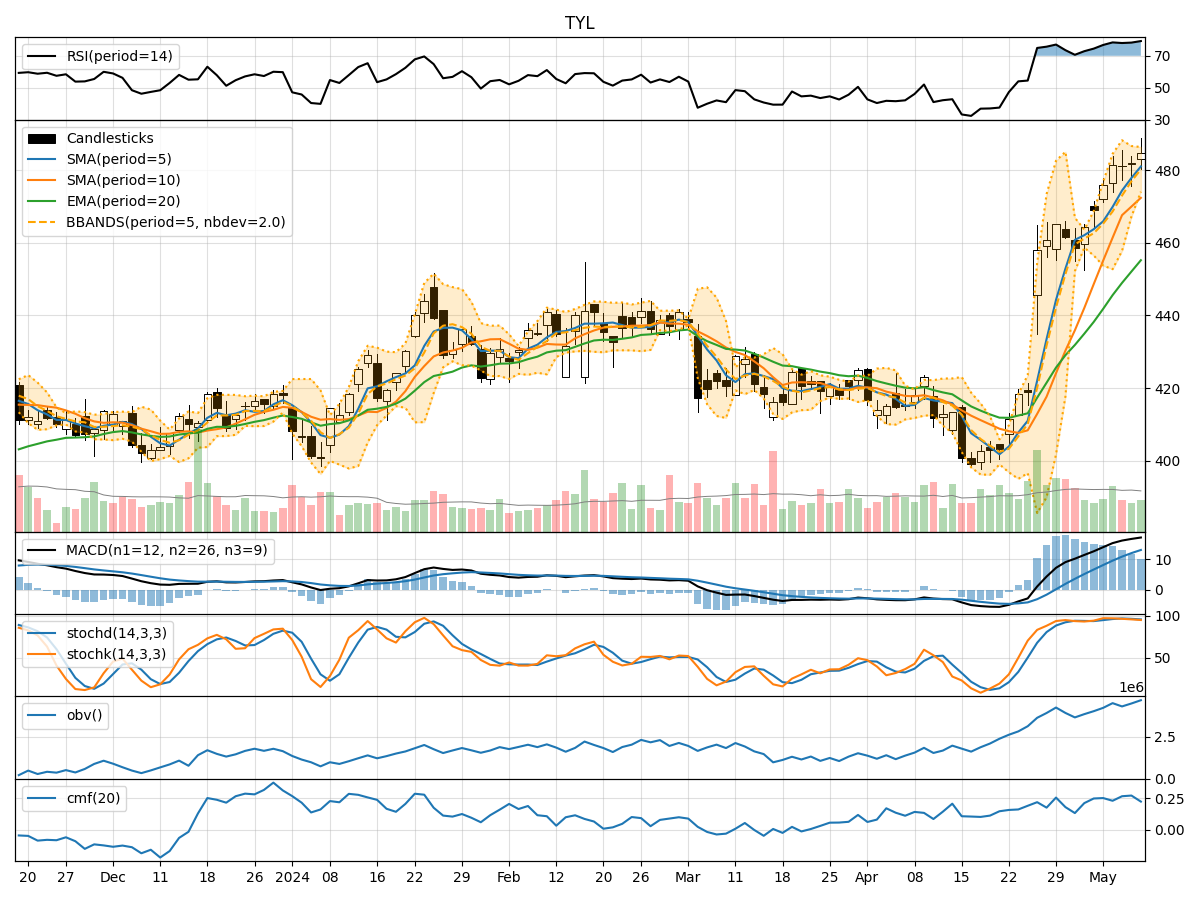
In analyzing the technical indicators for TYL over the last 5 days, we will delve into the trend, momentum, volatility, and volume indicators to provide a comprehensive outlook on the possible stock price movement in the coming days. By examining these key aspects, we aim to offer valuable insights and predictions for potential investors.
Trend Indicators:
- Moving Averages (MA): The 5-day moving average has been consistently rising, indicating a bullish trend in the short term.
- MACD: The MACD line has been increasing, suggesting upward momentum in the stock price.
- EMA: The exponential moving average has also been trending upwards, supporting the bullish sentiment.
Momentum Indicators:
- RSI: The Relative Strength Index has been in the overbought territory, signaling a strong bullish momentum.
- Stochastic Oscillator: Both %K and %D have been high, indicating an overbought condition.
- Williams %R: The indicator has been in the oversold region, suggesting a potential reversal.
Volatility Indicators:
- Bollinger Bands: The bands have been narrowing, indicating decreasing volatility and a possible period of consolidation.
- Bollinger %B: The %B indicator has been fluctuating within a tight range, reflecting the consolidation phase.
Volume Indicators:
- On-Balance Volume (OBV): The OBV has been increasing, showing accumulation by investors.
- Chaikin Money Flow (CMF): The CMF has been positive, indicating buying pressure in the stock.
Key Observations:
- The trend indicators suggest a strong bullish sentiment in the short term.
- Momentum indicators point towards an overbought condition, which may lead to a potential pullback.
- Volatility indicators indicate a period of consolidation and decreased price fluctuations.
- Volume indicators show positive accumulation and buying pressure in the stock.
Conclusion:
Based on the analysis of the technical indicators, the next few days' possible stock price movement for TYL is likely to experience a short-term pullback or consolidation after the recent bullish rally. The stock may enter a sideways phase as it digests the recent gains and establishes a new support level. Investors should exercise caution and consider potential profit-taking opportunities in the near future.