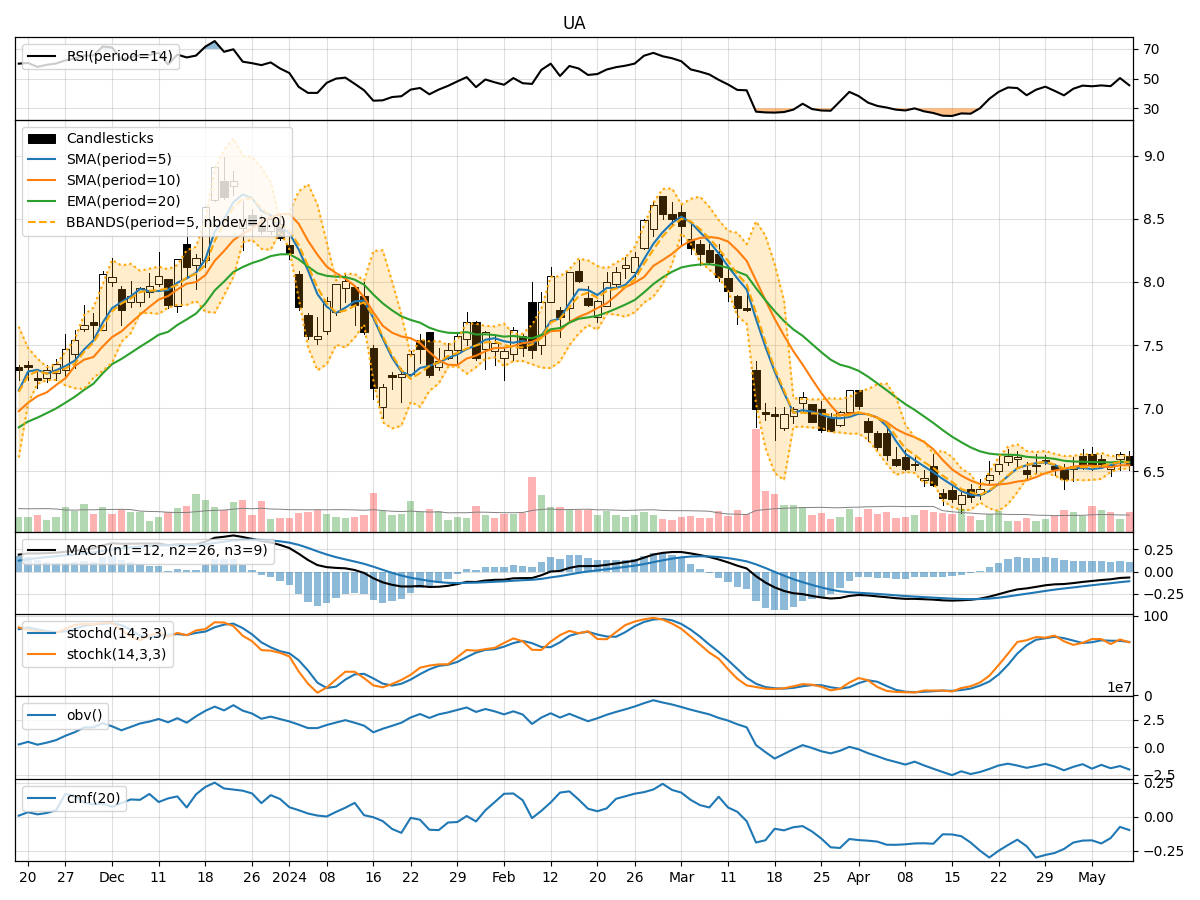
Technical Analysis of UA 2024-05-10
Overview:
In analyzing the technical indicators for UA stock over the last 5 days, we will delve into the trend, momentum, volatility, and volume indicators to provide a comprehensive outlook on the possible stock price movement in the coming days. By examining these key indicators, we aim to offer valuable insights and predictions for potential investors.
Trend Analysis:
- Moving Averages (MA): The 5-day Moving Average (MA) has been relatively stable around the current stock price, indicating a neutral trend.
- MACD: The Moving Average Convergence Divergence (MACD) has been consistently negative, suggesting a bearish trend.
- EMA: The Exponential Moving Average (EMA) has been slightly declining, reflecting a bearish sentiment in the short term.
Momentum Analysis:
- RSI: The Relative Strength Index (RSI) has been fluctuating around the 50 level, indicating a lack of strong momentum in either direction.
- Stochastic Oscillator: The Stochastic Oscillator shows mixed signals, with the %K and %D lines hovering around the mid-range, suggesting indecision in the market.
- Williams %R: The Williams %R indicator has been in the oversold territory, signaling a potential reversal in the short term.
Volatility Analysis:
- Bollinger Bands: The Bollinger Bands have shown narrowing volatility, with the bands squeezing closer together, indicating a potential breakout or significant price movement ahead.
- Bollinger %B: The %B indicator is currently below 1, suggesting that the stock price is trading near the lower band, potentially indicating an oversold condition.
Volume Analysis:
- On-Balance Volume (OBV): The OBV indicator has been fluctuating, indicating a lack of strong buying or selling pressure.
- Chaikin Money Flow (CMF): The CMF has been negative, suggesting that money may be flowing out of the stock.
Key Observations:
- The trend indicators point towards a bearish sentiment in the short term.
- Momentum indicators show a lack of strong directional momentum.
- Volatility indicators suggest a potential breakout or significant price movement.
- Volume indicators indicate a neutral stance with no clear accumulation or distribution pattern.
Conclusion:
Based on the analysis of the technical indicators, the stock price of UA is likely to experience further downward movement in the coming days. The bearish trend indicated by the MACD and EMA, coupled with the lack of strong momentum and negative money flow, suggests a potential continuation of the current downtrend. Traders should exercise caution and consider short-term selling strategies or wait for a clearer signal before entering a position.