Technical Analysis of UAA 2024-05-10
Overview:
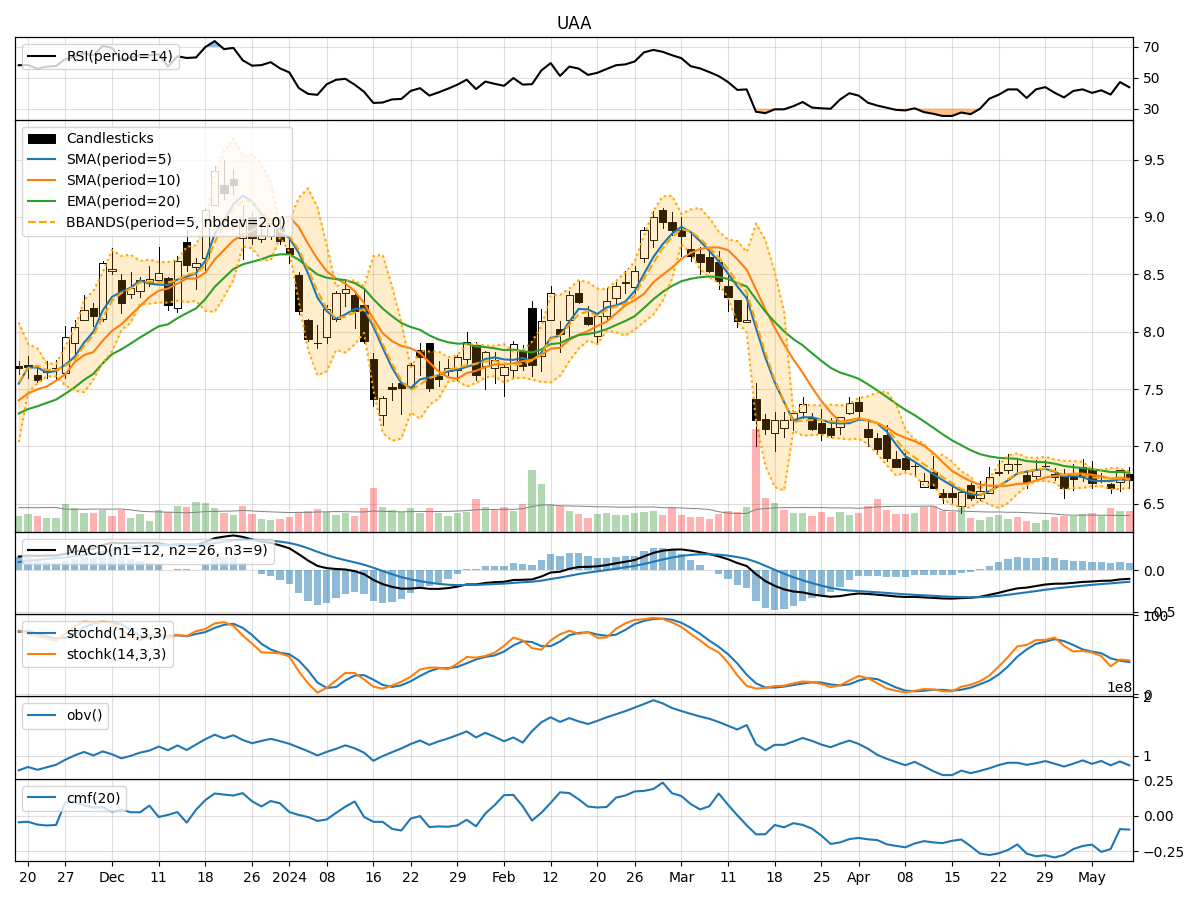
In analyzing the technical indicators for UAA over the last 5 days, we will delve into the trend, momentum, volatility, and volume indicators to provide a comprehensive assessment of the stock's potential price movement. By examining these key factors, we aim to offer valuable insights and predictions for the next few days.
Trend Analysis:
- Moving Averages (MA): The 5-day MA has been fluctuating around the closing prices, indicating a lack of clear trend direction.
- MACD: The MACD line has been consistently below the signal line, suggesting a bearish momentum in the short term.
- EMA: The EMA(20) has been gradually declining, reflecting a downward trend in the stock price.
Key Observation: The trend indicators point towards a bearish sentiment in the short term.
Momentum Analysis:
- RSI: The RSI has been hovering around the mid-level, indicating a neutral momentum.
- Stochastic Oscillator: Both %K and %D have been fluctuating, showing indecision in momentum.
- Williams %R: The Williams %R has been oscillating in the oversold and neutral zones.
Key Observation: Momentum indicators suggest a sideways movement with no clear direction.
Volatility Analysis:
- Bollinger Bands: The stock price has been trading within the bands, indicating normal volatility.
- Bollinger %B: The %B has been fluctuating around 0.5, suggesting equilibrium between volatility and price movement.
Key Observation: Volatility indicators signal a stable price movement with no extreme fluctuations.
Volume Analysis:
- On-Balance Volume (OBV): The OBV has been negative, indicating selling pressure in the stock.
- Chaikin Money Flow (CMF): The CMF has been consistently negative, reflecting a lack of buying interest.
Key Observation: Volume indicators point towards bearish sentiment with higher selling pressure.
Conclusion:
Based on the analysis of trend, momentum, volatility, and volume indicators, the overall outlook for UAA in the next few days is bearish. The trend indicators suggest a downward trajectory, while momentum indicators indicate a lack of clear direction. Volatility remains stable, but volume indicators highlight significant selling pressure.
Recommendation:
Considering the bearish sentiment and negative volume indicators, it is advisable to exercise caution when trading UAA in the short term. Traders may consider short-term selling strategies or wait for a clearer trend confirmation before making any significant investment decisions. Monitoring key support levels and potential reversal patterns is crucial in navigating the current market dynamics.