Technical Analysis of UBS 2024-05-10
Overview:
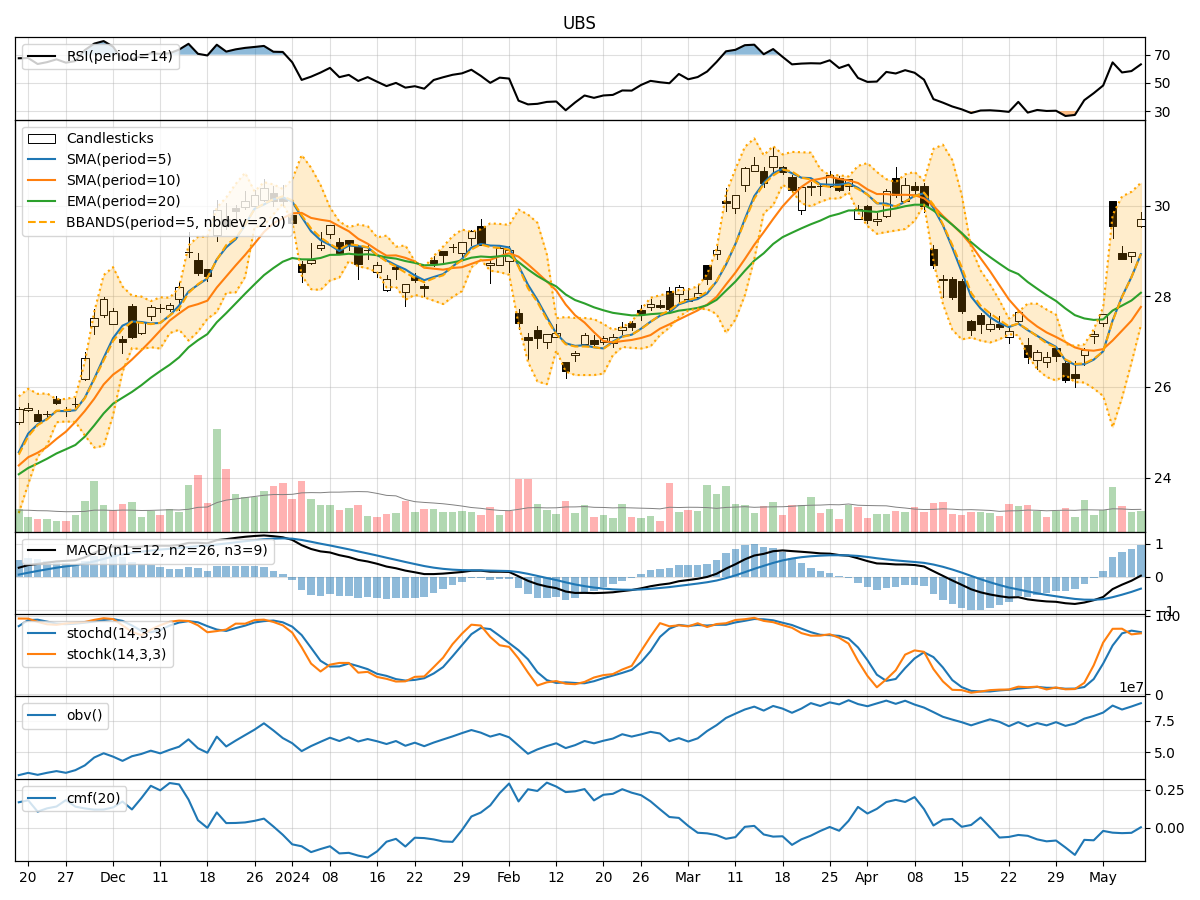
In analyzing the technical indicators for UBS stock over the last 5 days, we will delve into the trend, momentum, volatility, and volume indicators to provide a comprehensive outlook on the possible future stock price movement. By examining these key indicators, we aim to offer valuable insights and predictions for the upcoming trading days.
Trend Analysis:
- Moving Averages (MA): The 5-day Moving Average has been consistently trending above the Simple Moving Average (SMA) and Exponential Moving Average (EMA), indicating a bullish trend.
- MACD: The Moving Average Convergence Divergence (MACD) has shown positive values, with the MACD line consistently above the Signal line, suggesting bullish momentum.
- RSI: The Relative Strength Index (RSI) has been fluctuating around the 50 level, indicating a neutral stance in terms of overbought or oversold conditions.
Momentum Analysis:
- Stochastic Oscillator: The Stochastic Oscillator has been hovering in the overbought territory, suggesting a potential reversal or consolidation phase.
- Williams %R: The Williams %R indicator has shown mixed signals, moving between overbought and oversold levels, reflecting indecision in the market sentiment.
Volatility Analysis:
- Bollinger Bands: The Bollinger Bands have been widening, indicating increased volatility in the stock price.
- Volatility Bands: The Volatility Bands have shown an upward trend, suggesting potential price expansion in the near term.
Volume Analysis:
- On-Balance Volume (OBV): The OBV indicator has been relatively stable, indicating a balance between buying and selling pressure.
- Chaikin Money Flow (CMF): The CMF has been negative, signaling a lack of strong buying interest in the stock.
Key Observations:
- The trend indicators suggest a bullish bias in the short term, supported by positive MACD values and moving averages.
- Momentum indicators show a potential overbought condition, indicating a need for caution regarding further upside potential.
- Volatility indicators point towards increasing price fluctuations, which could lead to both opportunities and risks for traders.
- Volume indicators reflect a neutral stance, with no clear direction in terms of buying or selling pressure.
Conclusion:
Based on the analysis of the technical indicators, the stock price of UBS is likely to experience further upward movement in the next few days, supported by the bullish trend and positive momentum signals. However, traders should be cautious of the potential overbought conditions and increased volatility, which could lead to short-term corrections or consolidation phases. It is advisable to closely monitor the price action and key support/resistance levels for timely decision-making.