Technical Analysis of UHAL.B 2024-05-10
Overview:
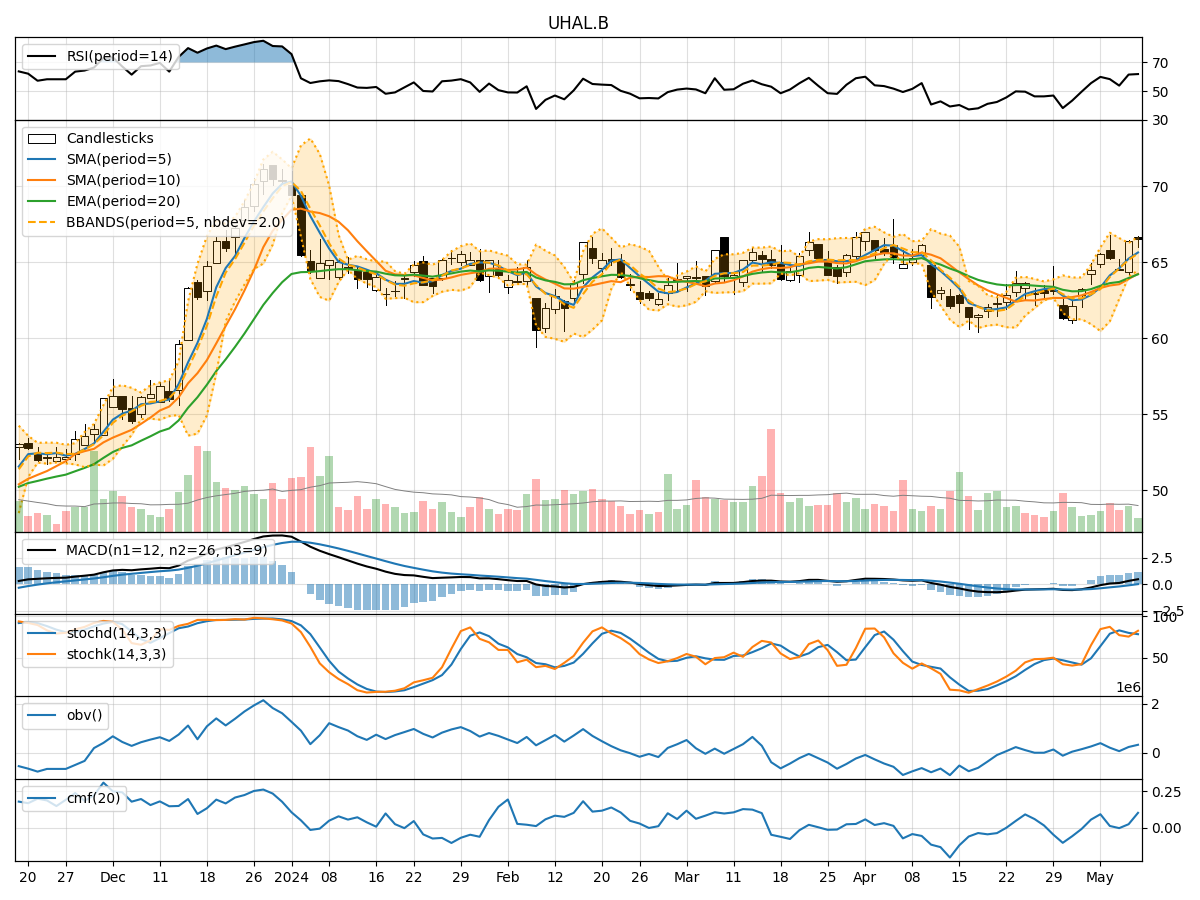
In the last 5 trading days, UHAL.B stock has shown mixed signals across various technical indicators. The trend indicators suggest a slightly bullish sentiment, with the moving averages trending upwards. Momentum indicators indicate a neutral to slightly bullish momentum, while volatility indicators show a decreasing trend in volatility. Volume indicators also suggest a positive accumulation of volume.
Trend Indicators:
- Moving Averages (MA): The 5-day MA has been consistently above the 10-day SMA, indicating a short-term bullish trend. The EMA(20) is also showing an upward trajectory, supporting a bullish view.
- MACD: The MACD line has been consistently above the signal line, with the MACD histogram showing an increasing trend, indicating bullish momentum.
Momentum Indicators:
- RSI: The RSI has been fluctuating around the 60-65 range, indicating a neutral to slightly bullish momentum.
- Stochastic Oscillator: Both %K and %D lines of the Stochastic Oscillator are in the overbought zone, suggesting a potential reversal or consolidation.
Volatility Indicators:
- Bollinger Bands: The Bollinger Bands are narrowing, indicating decreasing volatility and a potential upcoming breakout.
- Bollinger %B: The %B is hovering around 0.7, suggesting the stock is trading close to the upper band.
Volume Indicators:
- On-Balance Volume (OBV): The OBV has shown a positive accumulation of volume over the last 5 days, indicating buying pressure.
- Chaikin Money Flow (CMF): The CMF(20) is positive, suggesting that money is flowing into the stock.
Key Observations and Opinions:
- Trend: The trend indicators suggest a bullish bias in the short term.
- Momentum: Momentum indicators are mixed, with RSI indicating a neutral stance and Stochastic Oscillator hinting at a potential reversal.
- Volatility: Volatility is decreasing, which could precede a period of consolidation or a breakout.
- Volume: Accumulation of volume and positive CMF indicate underlying strength in the stock.
Conclusion:
Based on the analysis of the technical indicators, the next few days for UHAL.B stock could see further upward movement with a potential breakout from the narrowing Bollinger Bands. However, traders should be cautious of the overbought levels in the Stochastic Oscillator, which might lead to a short-term pullback or consolidation. Overall, the bullish trend supported by the moving averages and MACD suggests a positive outlook for the stock in the near term.