Technical Analysis of UMC 2024-05-10
Overview:
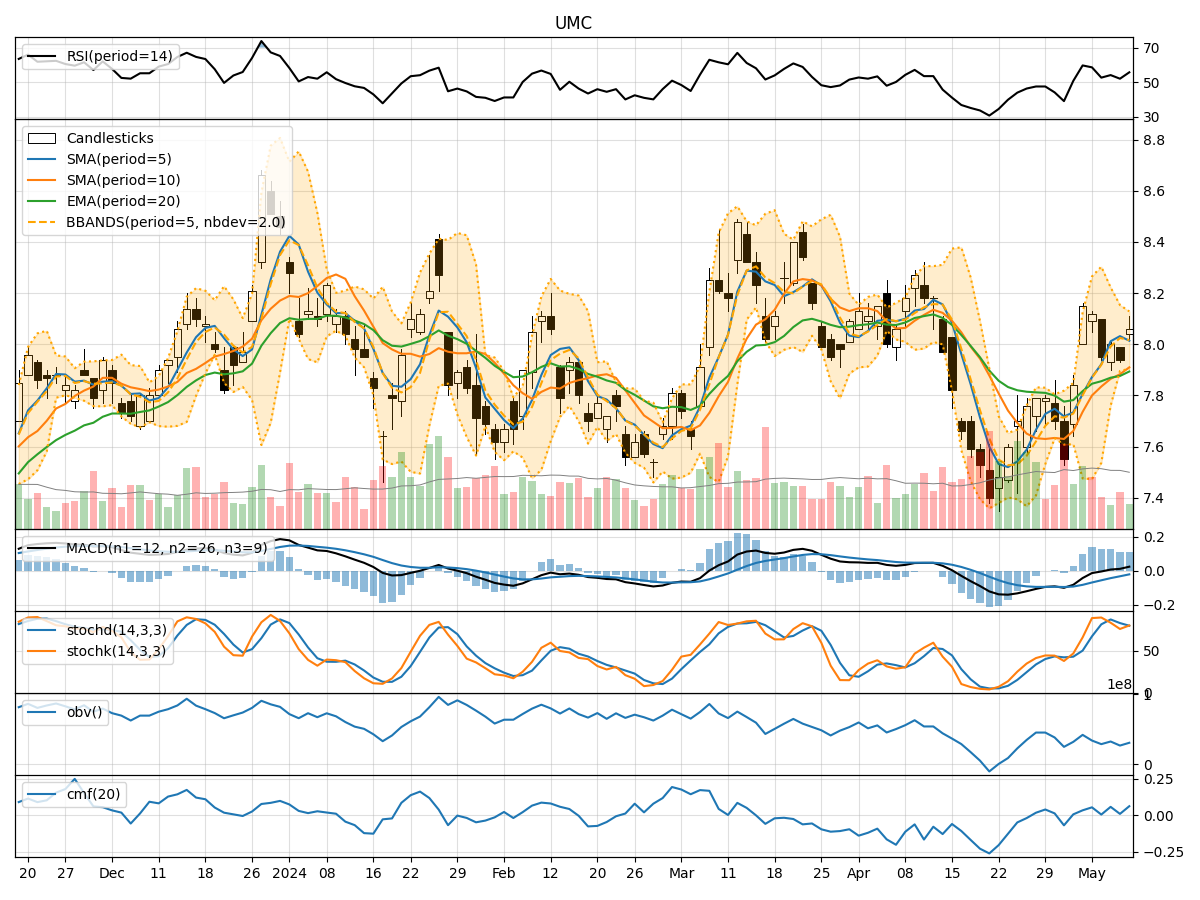
In analyzing the technical indicators for UMC over the last 5 days, we will delve into the trend, momentum, volatility, and volume indicators to provide a comprehensive outlook on the possible stock price movement. By examining these key aspects, we aim to offer valuable insights and predictions for the upcoming days.
Trend Analysis:
- Moving Averages (MA): The 5-day Moving Average (MA) has been steadily increasing, indicating a positive trend in the stock price.
- MACD: The MACD line has been consistently above the signal line, suggesting bullish momentum in the stock.
- RSI: The Relative Strength Index (RSI) has been fluctuating around the neutral zone, indicating a balanced buying and selling pressure.
Momentum Analysis:
- Stochastic Oscillator: The Stochastic Oscillator shows that the stock is neither overbought nor oversold, reflecting a stable momentum.
- Williams %R: The Williams %R indicator is hovering around the oversold territory, suggesting a potential buying opportunity.
Volatility Analysis:
- Bollinger Bands: The Bollinger Bands are narrowing, indicating decreasing volatility in the stock price.
- Average True Range (ATR): The ATR value has been decreasing, further confirming the reduced volatility in the stock.
Volume Analysis:
- On-Balance Volume (OBV): The OBV indicator has been fluctuating, signifying mixed buying and selling pressure.
- Chaikin Money Flow (CMF): The CMF value is positive, indicating that money is flowing into the stock.
Key Observations:
- The trend indicators suggest a bullish sentiment in the stock price.
- Momentum indicators point towards a neutral to slightly bullish momentum.
- Volatility indicators indicate decreasing volatility in the stock.
- Volume indicators show mixed buying and selling pressure.
Conclusion:
Based on the analysis of the technical indicators, the next few days' possible stock price movement for UMC is likely to be upward with a bullish bias. The trend is positive, momentum is stable, volatility is decreasing, and volume is showing mixed signals. Investors may consider entering long positions or holding onto existing positions with a target price higher than the current levels. However, it is essential to monitor the indicators closely for any signs of reversal or divergence to adjust the trading strategy accordingly.