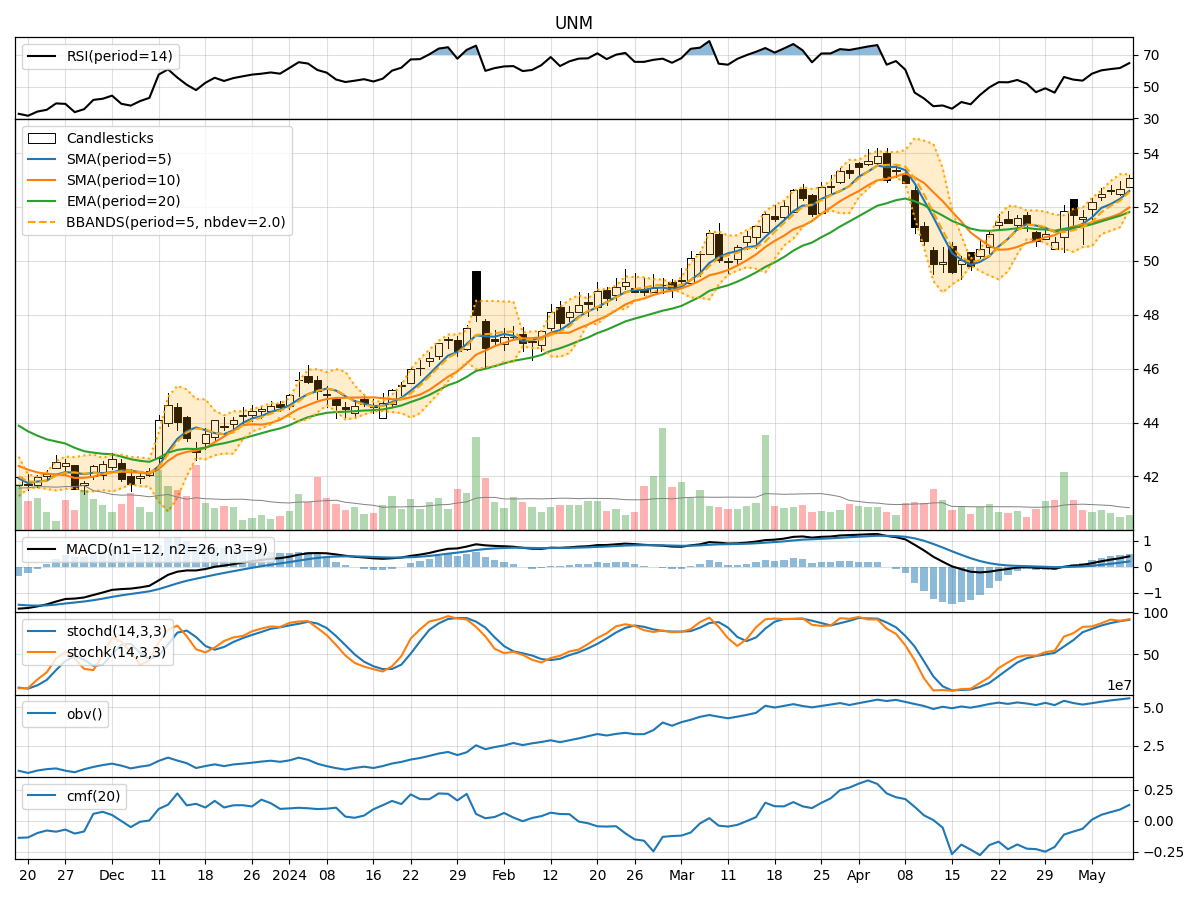
Technical Analysis of UNM 2024-05-10
Overview:
In analyzing the technical indicators for UNM over the last 5 days, we will delve into the trend, momentum, volatility, and volume indicators to provide a comprehensive outlook on the possible stock price movement in the coming days.
Trend Analysis:
- Moving Averages (MA): The 5-day Moving Average (MA) has been consistently rising, indicating a bullish trend.
- MACD: The MACD line has been above the signal line, suggesting a bullish momentum.
- EMA: The Exponential Moving Average (EMA) has been steadily increasing, supporting the bullish trend.
Momentum Analysis:
- RSI: The Relative Strength Index (RSI) has been in the overbought territory, indicating a strong bullish momentum.
- Stochastic Oscillator: Both %K and %D have been in the overbought zone, signaling a strong bullish momentum.
- Williams %R: The indicator has been in the oversold region, suggesting a potential reversal.
Volatility Analysis:
- Bollinger Bands (BB): The stock price has been trading near the upper Bollinger Band, indicating high volatility.
- Bollinger Band Width: The Band Width has been narrowing, suggesting a potential decrease in volatility.
Volume Analysis:
- On-Balance Volume (OBV): The OBV has been steadily increasing, indicating strong buying pressure.
- Chaikin Money Flow (CMF): The CMF has been positive, reflecting buying interest in the stock.
Key Observations:
- The trend indicators, momentum indicators, and volume indicators all point towards a bullish sentiment in the market.
- The volatility indicators suggest that while there has been high volatility, there might be a potential decrease in volatility in the near future.
Conclusion:
Based on the analysis of the technical indicators, the next few days are likely to see a continuation of the bullish trend in UNM stock. Traders and investors may consider buying opportunities in anticipation of further price appreciation. However, it is essential to monitor the indicators closely for any signs of a potential reversal in the trend.