Technical Analysis of UPS 2024-05-10
Overview:
In analyzing the technical indicators for UPS over the last 5 days, we will delve into the trend, momentum, volatility, and volume indicators to provide a comprehensive outlook on the possible stock price movement in the coming days. By examining these key indicators, we aim to offer valuable insights and predictions for potential investors and traders.
Trend Indicators:
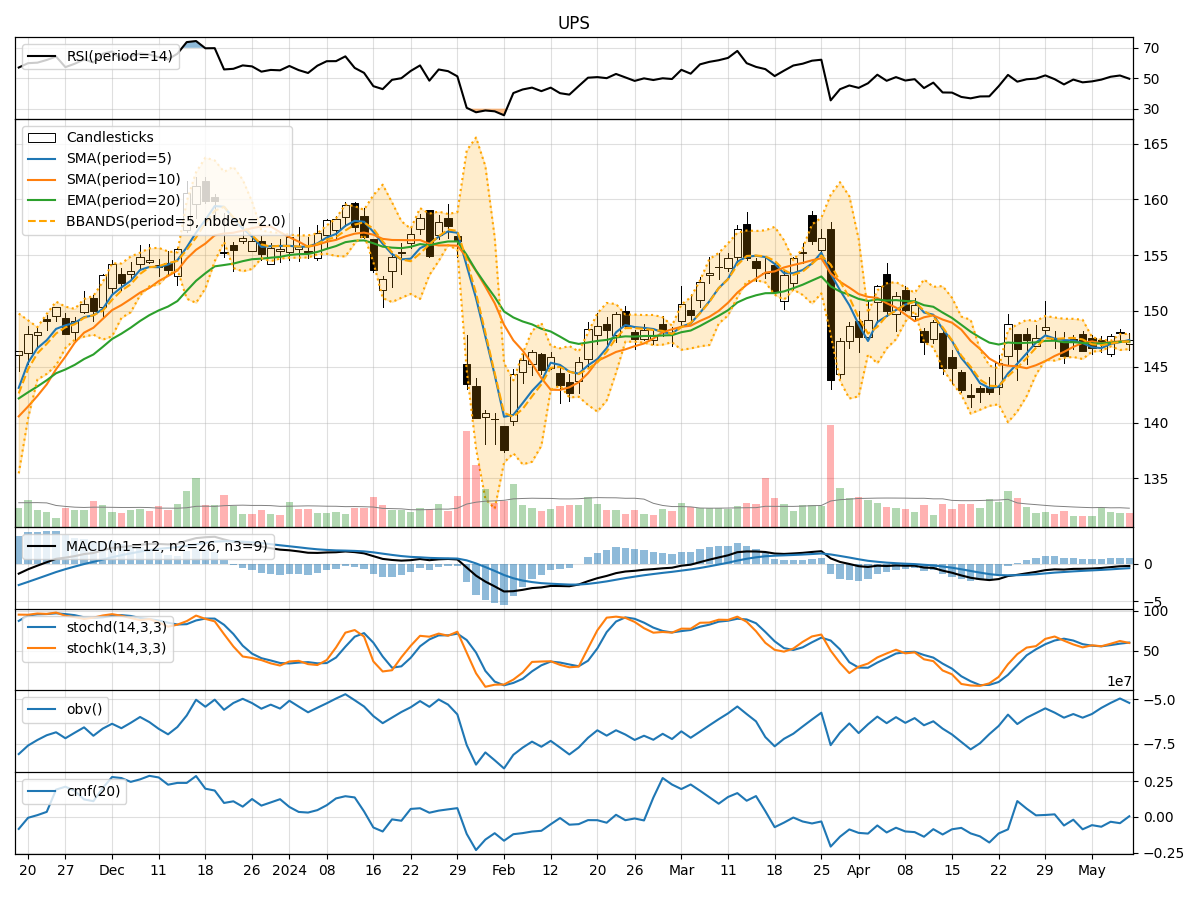
- Moving Averages (MA): The 5-day moving average has been showing an upward trend, indicating a positive momentum in the stock price.
- MACD: The MACD line has been consistently above the signal line, suggesting a bullish trend in the stock.
- EMA: The exponential moving average has been steadily increasing, supporting the bullish sentiment in the stock.
Momentum Indicators:
- RSI: The Relative Strength Index has been gradually increasing, indicating strengthening momentum in the stock.
- Stochastic Oscillator: Both %K and %D lines of the stochastic oscillator have been rising, signaling a bullish momentum.
- Williams %R: The Williams %R indicator has been moving towards the oversold territory, suggesting a potential buying opportunity.
Volatility Indicators:
- Bollinger Bands: The Bollinger Bands have been widening, indicating increased volatility in the stock price.
- Bollinger %B: The %B indicator has been fluctuating within the bands, reflecting the volatility in the stock.
- Average True Range (ATR): The ATR has shown an uptick, suggesting an increase in volatility.
Volume Indicators:
- On-Balance Volume (OBV): The OBV indicator has been steadily increasing, indicating strong buying pressure in the stock.
- Chaikin Money Flow (CMF): The CMF has been negative but showing signs of improvement, suggesting a potential shift towards buying pressure.
Key Observations and Opinions:
- Trend: The trend indicators suggest a bullish sentiment in the stock, supported by moving averages and MACD.
- Momentum: Momentum indicators point towards a strengthening bullish momentum, as indicated by RSI and stochastic oscillator.
- Volatility: Volatility indicators show an increase in volatility, which could lead to larger price swings in the coming days.
- Volume: Volume indicators reflect strong buying pressure, especially highlighted by the rising OBV.
Conclusion:
Based on the analysis of the technical indicators, the outlook for UPS stock in the next few days is bullish. The trend and momentum indicators support a continued upward movement in the stock price, while the increasing volatility may lead to larger price fluctuations. The strong buying pressure indicated by volume indicators further reinforces the bullish view. Investors and traders may consider buying opportunities in UPS stock for potential short to medium-term gains.