Technical Analysis of URI 2024-05-10
Overview:
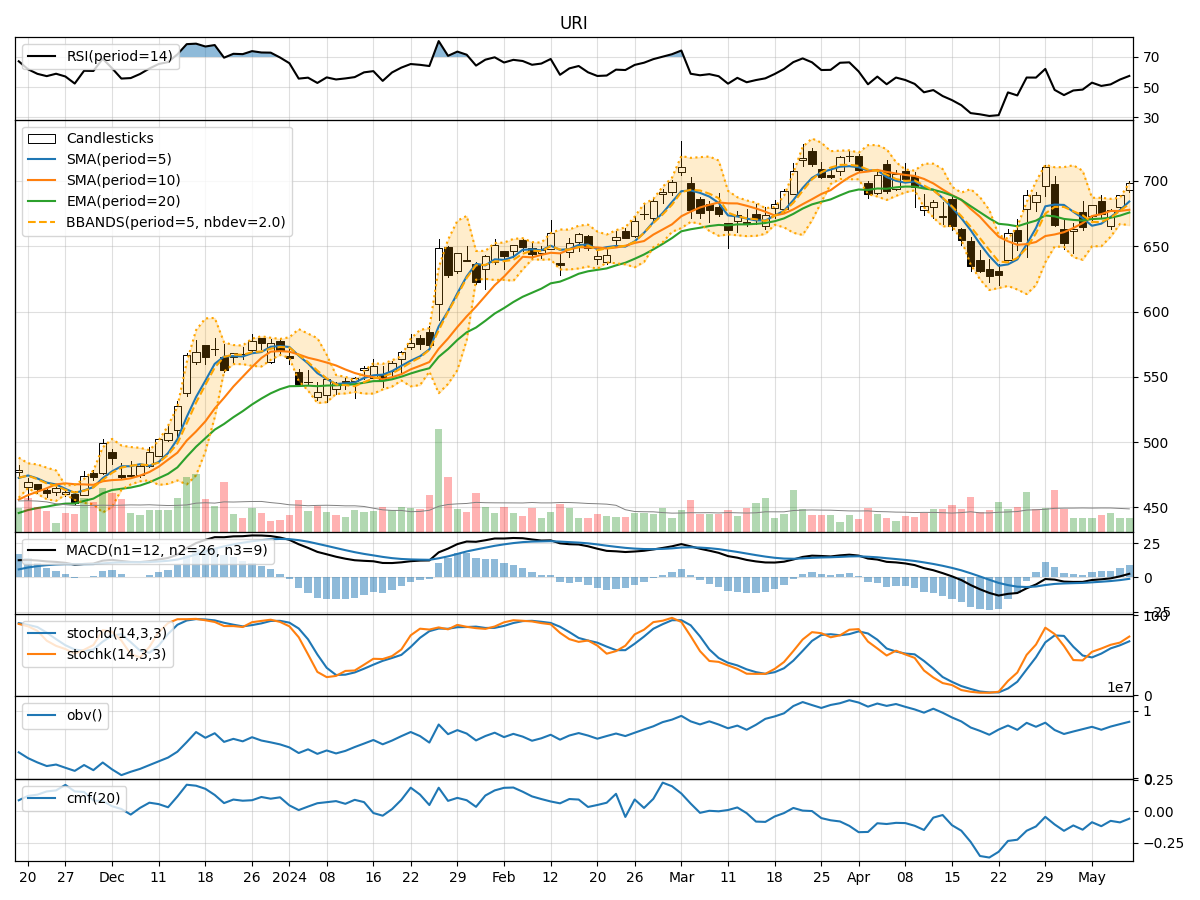
In the last 5 trading days, the stock price has shown a mixed trend with fluctuations in both price and volume. The trend indicators suggest a gradual increase in price, supported by moving averages and MACD indicators. Momentum indicators show a positive momentum building up, while volatility indicators indicate an expanding price range. Volume indicators, however, show a slight decrease in On-Balance Volume (OBV) and Chaikin Money Flow (CMF).
Trend Analysis:
- Moving Averages (MA): The 5-day MA has been consistently above the closing price, indicating a bullish trend.
- MACD: The MACD line has been increasing, crossing above the signal line, suggesting a bullish momentum.
- EMA: The EMA has been steadily rising, supporting the uptrend.
Momentum Analysis:
- RSI: The RSI has been increasing, indicating strengthening buying pressure.
- Stochastic Oscillator: Both %K and %D lines are in the overbought zone, suggesting a potential reversal.
- Williams %R: The indicator is in the oversold region, indicating a possible buying opportunity.
Volatility Analysis:
- Bollinger Bands (BB): The bands have been widening, indicating increased volatility.
- BB %B: The %B is above 0.8, suggesting the stock is trading near the upper band.
Volume Analysis:
- OBV: The OBV has shown a slight decrease, indicating some distribution.
- CMF: The CMF has been negative, suggesting selling pressure.
Key Observations:
- The stock is in an upward trend supported by moving averages and MACD.
- Momentum indicators show bullish momentum but are in overbought territory, signaling a potential reversal.
- Volatility is increasing, indicating wider price fluctuations.
- Volume indicators suggest some distribution as OBV and CMF show a slight decline.
Conclusion:
Based on the analysis of technical indicators, the next few days' possible stock price movement is likely to be sideways to slightly bearish. The stock may experience a short-term pullback or consolidation phase after the recent uptrend. Traders should watch for signs of reversal in momentum indicators and monitor price action around the upper Bollinger Band for potential resistance. It is advisable to wait for confirmation signals before making any significant trading decisions.