Technical Analysis of UVE 2024-05-10
Overview:
In analyzing the technical indicators for UVE over the last 5 days, we will delve into the trend, momentum, volatility, and volume indicators to provide a comprehensive outlook on the possible stock price movement in the coming days. By examining these key aspects, we aim to offer valuable insights and predictions for potential investors.
Trend Analysis:
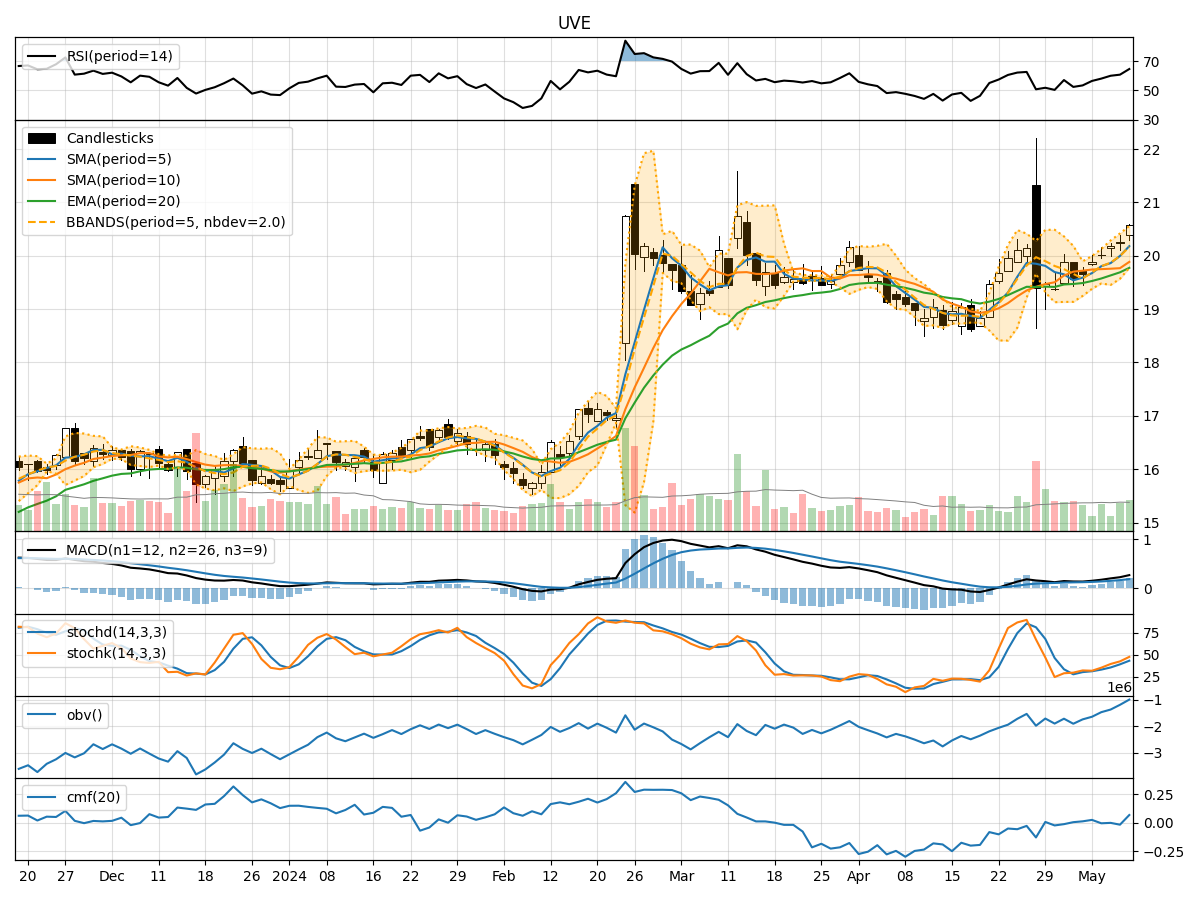
- Moving Averages (MA): The 5-day Moving Average (MA) has been consistently above the Simple Moving Average (SMA) and Exponential Moving Average (EMA), indicating a bullish trend.
- MACD: The MACD line has been above the signal line, with both lines showing an upward trend, suggesting bullish momentum.
- Momentum: The stock price has been consistently above the MA indicators, reflecting positive momentum in the recent trading days.
Momentum Analysis:
- RSI: The Relative Strength Index (RSI) has been trending upwards, indicating increasing buying pressure.
- Stochastic Oscillator: Both %K and %D lines of the Stochastic Oscillator are rising, suggesting bullish momentum.
- Williams %R: The Williams %R is moving towards the oversold region, indicating a potential buying opportunity.
Volatility Analysis:
- Bollinger Bands (BB): The stock price has been trading within the Bollinger Bands, with the bands widening slightly, indicating increased volatility.
- Bollinger %B: The %B indicator is above 0.8, suggesting the stock is trading near the upper band, potentially overbought.
Volume Analysis:
- On-Balance Volume (OBV): The OBV has been increasing, indicating higher buying volume in the recent trading sessions.
- Chaikin Money Flow (CMF): The CMF is positive, suggesting money flow into the stock over the past 20 days.
Conclusion:
Based on the analysis of the technical indicators, the overall outlook for UVE is bullish in the short term. The trend indicators, momentum oscillators, and volume indicators all point towards a potential upward movement in the stock price. The increasing buying pressure, positive momentum, and rising OBV signal a favorable environment for further price appreciation.
Considering the bullish signals across various technical indicators, it is likely that UVE will experience an upward price movement in the next few trading days. Investors may consider taking long positions or holding onto existing positions to capitalize on the anticipated price appreciation. However, it is essential to monitor the indicators closely for any signs of reversal or divergence to adjust trading strategies accordingly.