Technical Analysis of UWMC 2024-05-10
Overview:
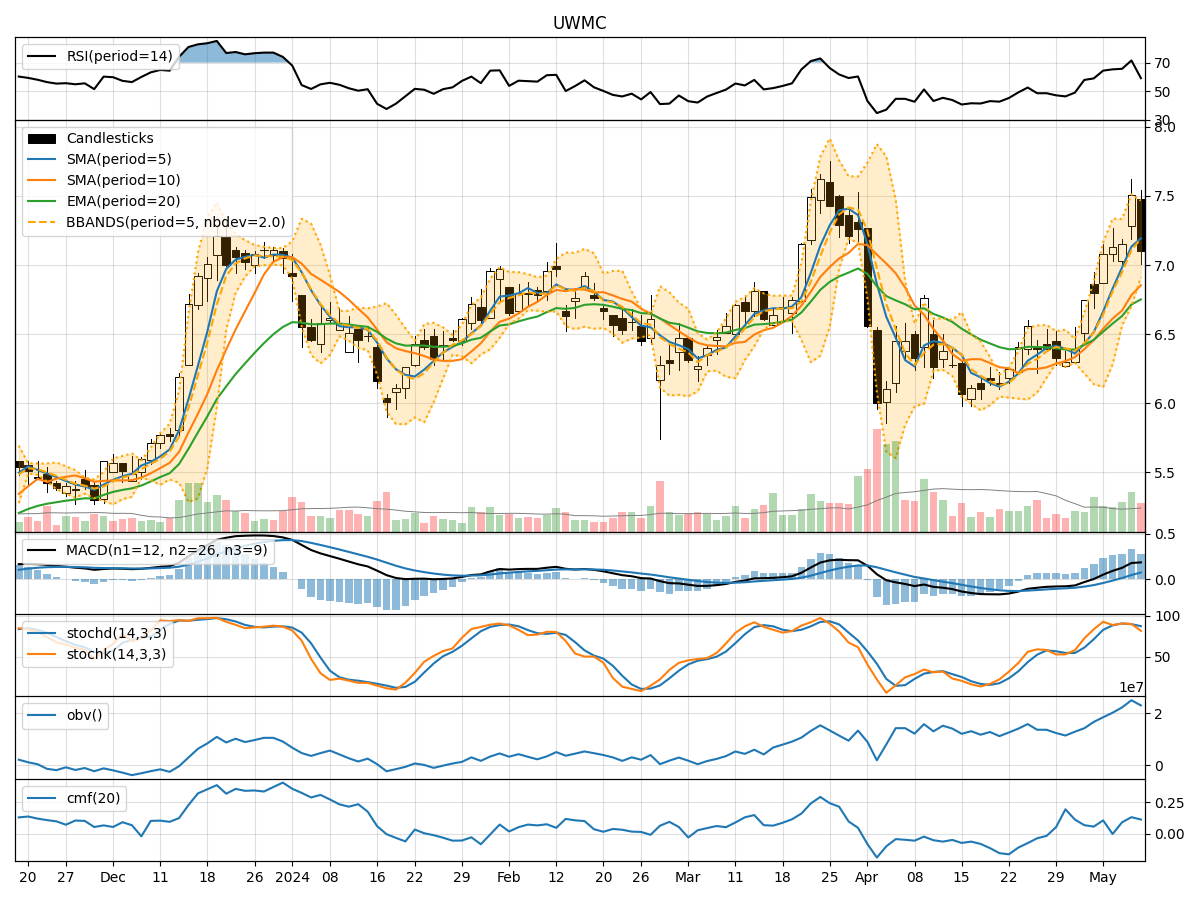
In analyzing the technical indicators for UWMC over the last 5 days, we will delve into the trend, momentum, volatility, and volume indicators to provide a comprehensive assessment of the stock's potential price movement. By examining these key factors, we aim to offer insights and predictions for the next few days.
Trend Analysis:
- Moving Averages (MA): The 5-day Moving Average (MA) has been consistently above the Simple Moving Average (SMA) and Exponential Moving Average (EMA), indicating a bullish trend.
- MACD: The MACD line has been consistently above the signal line, with positive values, suggesting bullish momentum.
Momentum Analysis:
- RSI: The Relative Strength Index (RSI) has been fluctuating but generally staying within the neutral to overbought territory, indicating mixed momentum.
- Stochastic Oscillator: Both %K and %D have been relatively high, suggesting potential overbought conditions.
Volatility Analysis:
- Bollinger Bands (BB): The stock price has been mostly within the Bollinger Bands, with the bands narrowing, indicating decreasing volatility.
Volume Analysis:
- On-Balance Volume (OBV): The OBV has shown an overall positive trend, indicating accumulation by investors.
- Chaikin Money Flow (CMF): The CMF has been positive, suggesting buying pressure in the stock.
Key Observations:
- The trend indicators suggest a bullish sentiment, supported by the moving averages and MACD.
- Momentum indicators show mixed signals, with RSI fluctuating and stochastic oscillators indicating potential overbought conditions.
- Volatility has been decreasing, as seen in the narrowing Bollinger Bands.
- Volume indicators point towards accumulation and buying pressure in the stock.
Conclusion:
Based on the analysis of the technical indicators, the next few days for UWMC could see continued upward movement in the stock price. The bullish trend indicated by moving averages and MACD, coupled with positive volume indicators, suggests potential for further price appreciation. However, caution is advised due to mixed momentum signals and potential overbought conditions highlighted by the stochastic oscillator. Traders and investors should closely monitor price action and key support/resistance levels for timely decision-making.
Recommendation:
- Short-term: Consider taking partial profits if the stock price reaches significant resistance levels.
- Long-term: Hold positions with a trailing stop-loss to protect gains and capitalize on potential further upside.
By combining insights from trend, momentum, volatility, and volume indicators, investors can make informed decisions aligned with the prevailing market dynamics.