Technical Analysis of VAC 2024-05-10
Overview:
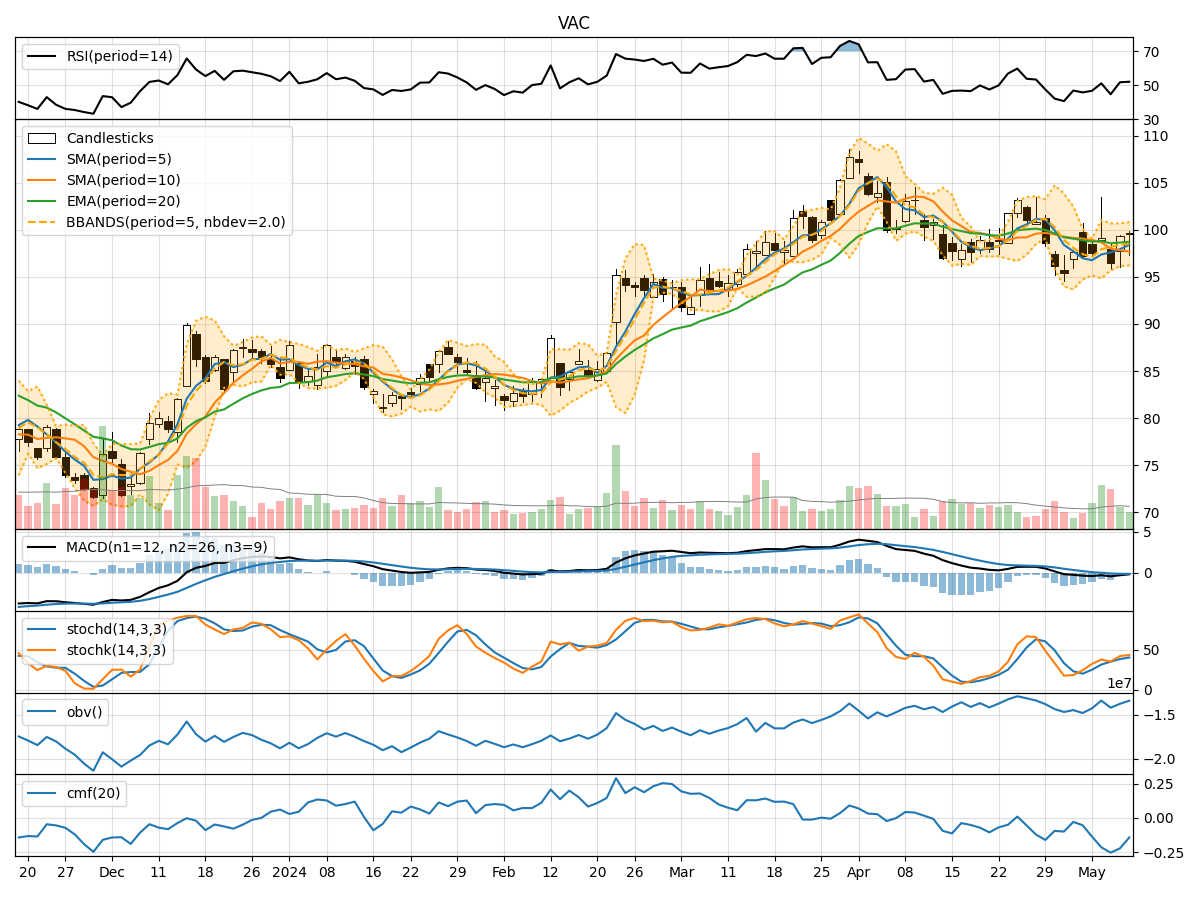
In analyzing the technical indicators for VAC over the last 5 days, we will delve into the trend, momentum, volatility, and volume indicators to provide a comprehensive outlook on the possible stock price movement in the coming days. By examining these key indicators, we aim to offer valuable insights and predictions for potential investors and traders.
Trend Analysis:
- Moving Averages (MA): The 5-day Moving Average (MA) has been fluctuating around the closing prices, indicating short-term price trends. The Simple Moving Average (SMA) and Exponential Moving Average (EMA) show a slight downward trend, suggesting a potential bearish sentiment.
- MACD: The Moving Average Convergence Divergence (MACD) has been negative, with the MACD line consistently below the signal line. This indicates a bearish momentum in the stock price.
- Conclusion: The trend indicators suggest a bearish outlook for VAC in the short term.
Momentum Analysis:
- RSI: The Relative Strength Index (RSI) has been hovering around the neutral zone, indicating a lack of strong momentum in either direction.
- Stochastic Oscillator: Both %K and %D lines of the Stochastic Oscillator are below 50, suggesting a bearish momentum.
- Conclusion: The momentum indicators also point towards a bearish sentiment for VAC.
Volatility Analysis:
- Bollinger Bands (BB): The Bollinger Bands show a narrowing of the bands, indicating decreasing volatility in the stock price.
- Conclusion: The volatility indicators suggest a low volatility environment for VAC currently.
Volume Analysis:
- On-Balance Volume (OBV): The OBV has been relatively stable, indicating a balance between buying and selling pressure.
- Chaikin Money Flow (CMF): The CMF has been negative, suggesting a bearish money flow into the stock.
- Conclusion: The volume indicators reflect a neutral to bearish sentiment in terms of trading volume.
Overall Conclusion:
Based on the analysis of trend, momentum, volatility, and volume indicators, the overall outlook for VAC in the next few days is bearish. The trend indicators, momentum signals, and volume analysis all point towards a potential downward movement in the stock price. The low volatility environment further supports the likelihood of a bearish trend continuation.
Recommendation:
Considering the bearish signals across multiple technical indicators, it may be prudent for investors to exercise caution or consider short-term trading strategies to capitalize on potential downward movements in VAC. Traders could look for entry points to go short on the stock, while investors may want to wait for more clarity in the market dynamics before making significant investment decisions.
Disclaimer:
It is important to note that technical analysis is not a guaranteed predictor of future price movements, and market conditions can change rapidly. It is advisable to conduct thorough research, consider fundamental factors, and consult with a financial advisor before making any investment decisions.